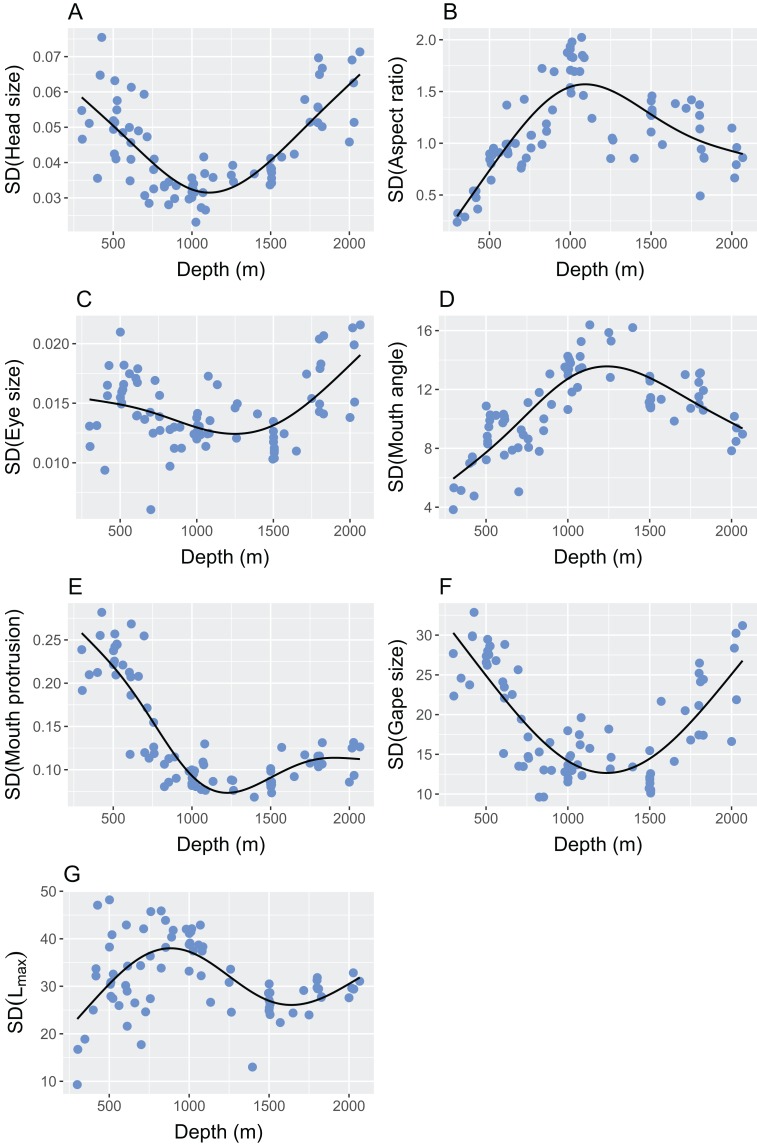
Figure 6. The relationship between depth and the standard deviation of the continuous morphological traits used in the calculation of functional diversity.
The traits were (A) relative head size (cm/cm); (B) caudal fin aspect ratio (cm2/cm2/cm); (C) relative eye size (cm/cm); (D) angle of mouth in relation to lateral line (°); (E) relative surface area of mouth protrusion (cm2/cm); (F) relative gape size (mm2/cm); (G) Lmax (cm). Please see Fig. 2 and Table 2 for definitions and calculations of traits.

