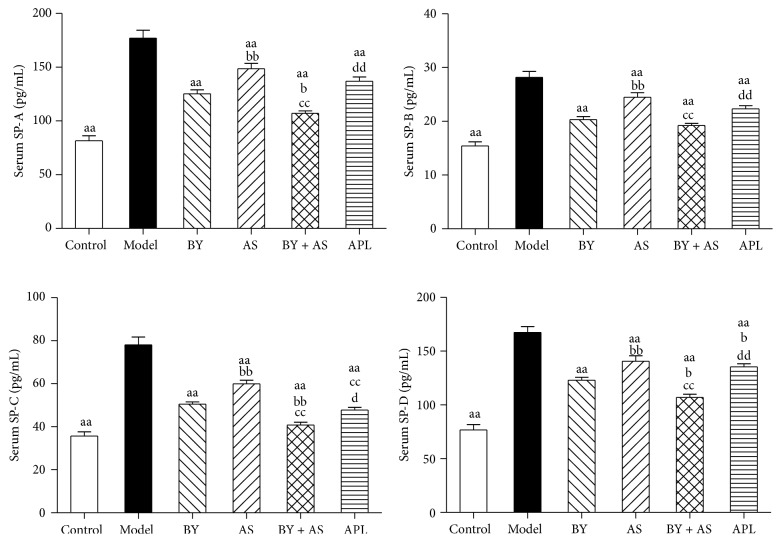
Figure 2.
The levels of SP-A, SP-B, SP-C, and SP-D in serum in all treatment group. Control: control group; Model: model group; AS: acupoint sticking group; BY: Bufei Yishen group; BY + AS: Bufei Yishen + acupoint sticking group; APL: aminophylline group. Values represent the mean ± SEM. aa P < 0.01 versus Model; bb P < 0.01, b P < 0.05 versus BY; cc P < 0.01 versus AS; dd P < 0.01, d P < 0.05 versus BY + AS.

