
Figure 2. Age coefficients (estimates and confidence intervals, CIs) from best-fitting Poisson models for females.
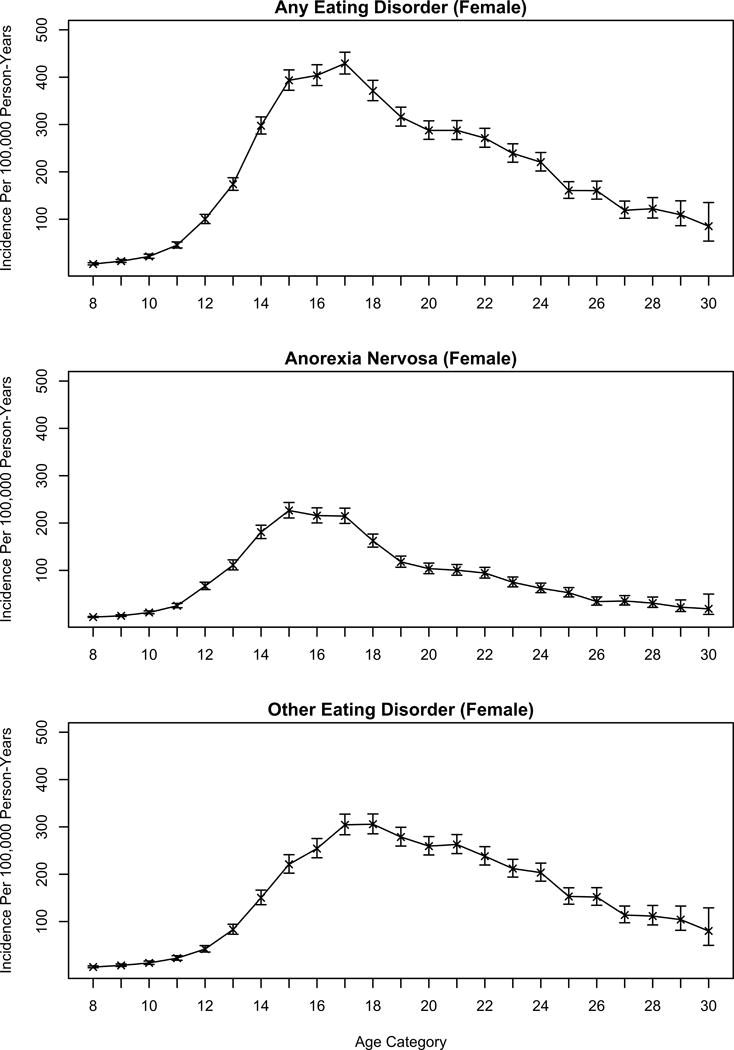
Each plot represents a different outcome (Any Eating Disorders; Anorexia Nervosa; Other Eating Disorders). Within a plot, Xs refer to estimates; bars refer to bounds of 95% CIs. Estimates (and lower and upper bounds of CIs) for age are transformed by exp(x)*100000, and represent model-based estimates of the incidence (per 100,000 person-years) for the age in question during the 2008–2009 period (and, for the Other Eating Disorder outcome only, for the 1979–1990 birth cohort).