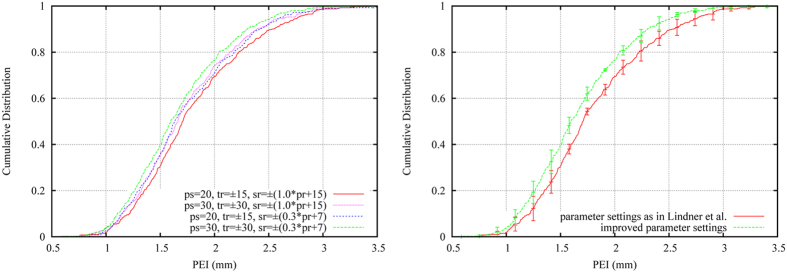
Figure 3. Cumulative distribution of image-specific point-to-point results for parameter optimisation of the FALA system: (left) comparing different combinations of patch size (ps), training range (tr) and search range (sr); and (right) showing the difference in performance between the original23 and the improved parameter settings.
Error bars show the 95% confidence interval across the four cross-validation experiments.

