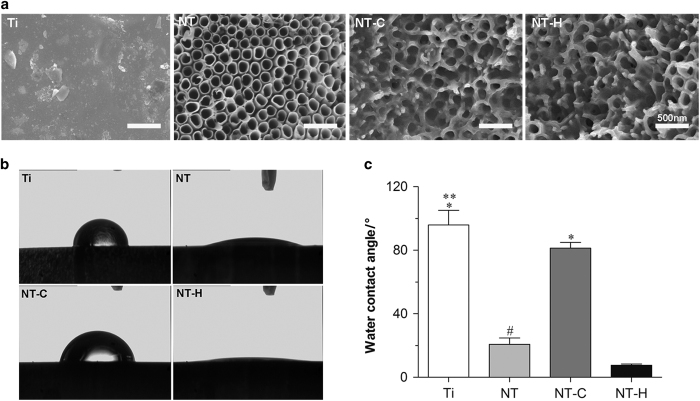
Figure 1.
Surface characterization of the four different specimens. (a) Surface morphology using scanning electron microscopy (SEM). The surfaces of the drug-loaded nanotubes reserve the nanotubular structure. Magnification, ×50 000. The scale bar for the row is shown in the last image. (b), (c) Water contact angles of various specimens. *P<0.01, compared with titania nanotubes without drug-loading (NT) and HACC-loaded titania nanotubes (NT-H); **P<0.05, compared with chitosan-loaded titania nanotubes (NT-C); #P<0.05, compared with NT-H.

