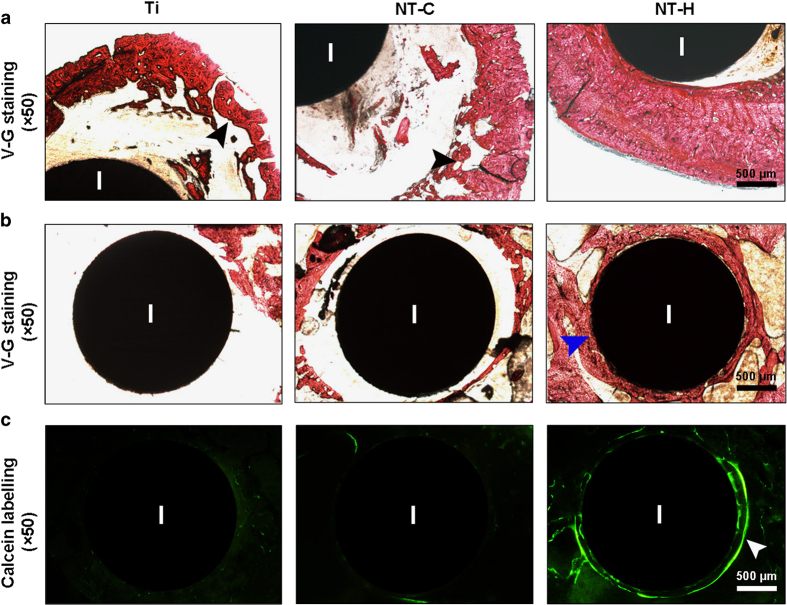
Figure 8.
Representative histological images obtained from undecalcified transverse sections containing implants. Van Gieson staining was used to evaluate the (a) morphological changes in the cortical bone at the middle of the femur, and (b) the osteointegration around the implants at the condyle of the femur. (c) Fluorescent micrographs demonstrating new bone formation around the implants at 42 days after implantation. Black arrowheads, massive enlargement and destruction of the bone cortex; blue arrowheads, osteointegration around the implants; white arrowheads, obvious fluorescent deposition indicating new bone formation around the implants. I, implant. The scale bar for the row is shown in the last image.

