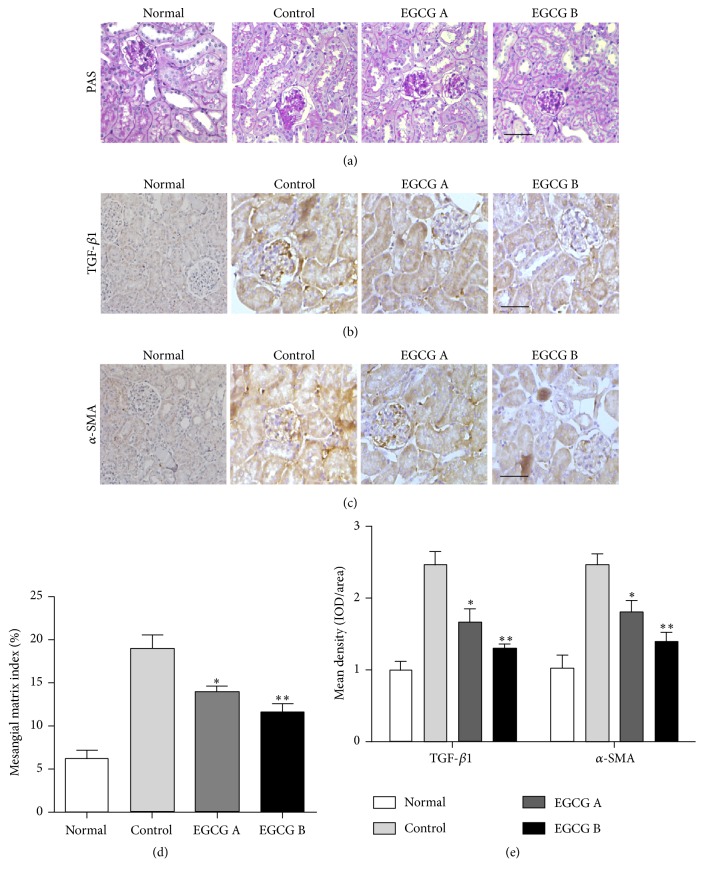
Figure 5.
Effect of EGCG on renal pathological changes and fibrosis. Renal pathological changes were examined by PAS staining (a and d). The protein expression levels of TGF-β1 and α-SMA were evaluated by immunohistochemistry (b, c, and e). Scale bar: 50 μm; n = 8 in each group. Normal: nontreated C57BL mice; control: C57BLKS/J db/db nontreated mice; EGCG A, db/db mice treated with EGCG of 50 mg/kg/d; EGCG B, db/db mice treated with EGCG of 100 mg/kg/d; values are means ± SEM. ∗ P < 0.05 and ∗∗ P < 0.01 versus control.

