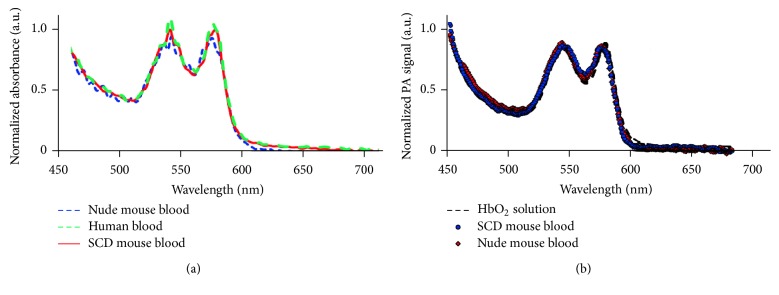
Figure 3.
Absorption and PA spectra of HbS and HbA alone and in RBCs. (a) Conventional absorption spectroscopy of nude mouse blood, SCD mouse blood, and human blood. Sample absorption was normalized to absorption at 450 nm. (b) Single cell PA spectroscopy using spectrally tunable automatic laser optical parametric oscillator (OPO). The spectrum of HbO2 was acquired using conventional spectroscopy from 90% oxygenated hemoglobin solution.

