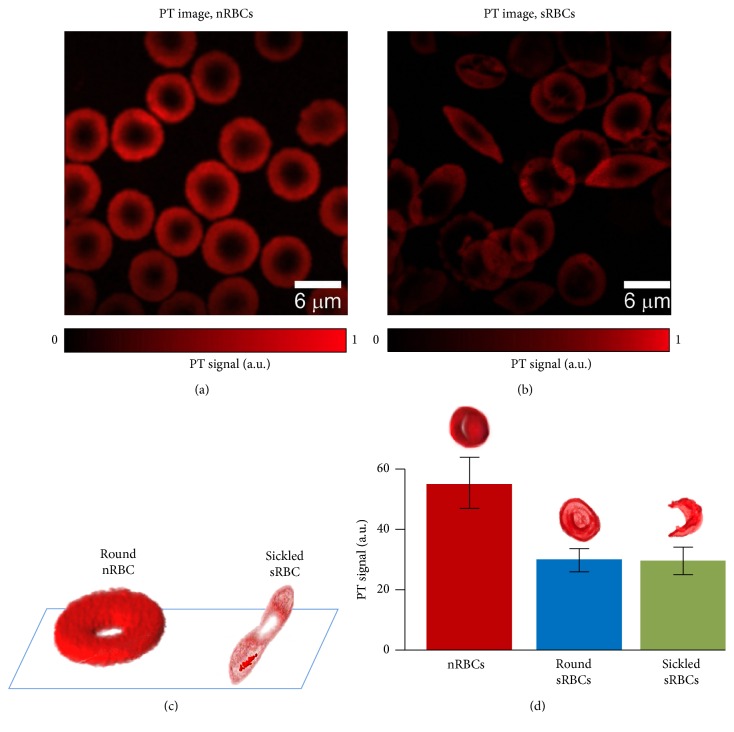
Figure 4.
High resolution PT imaging of nRBCs and sRBCs in vitro. (a, b) PT images of nRBCs and sRBCs. (c) 3D reconstruction of absorption profile based on z-stack of multiple PT images for a healthy nRBC (left) and a single sickled sRBC (right). (d) PT signal amplitudes from individual nRBCs and sRBCs with round and deformed shape. Laser parameters: wavelength, 532 nm; energy fluence, 20 mJ/cm2; laser beam diameter, 0.5 μm.

