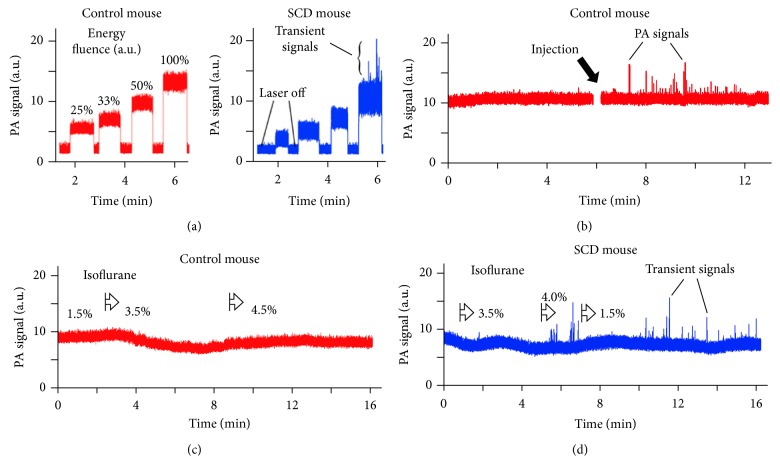
Figure 7.
In vivo PAFC of sRBCs in SCD mice. (a) Typical in vivo PA signal traces from mouse ear microvessels (veins) at different laser energy fluence (relative units) for control nude (left) and SCD (right) mice. (b) In vivo PA signal trace after intravenous injection of 100 μL of SCD mouse blood into healthy mouse blood circulatory system. (c, d) In vivo PA signal traces in normal nude mice (c) and SCD mice (d) during isoflurane induced hypoxia. Laser parameters: wavelength, 820 nm (a–d); laser energy fluence, 10–600 mJ/cm2(a) and 500 mJ/cm2 (b–d).

