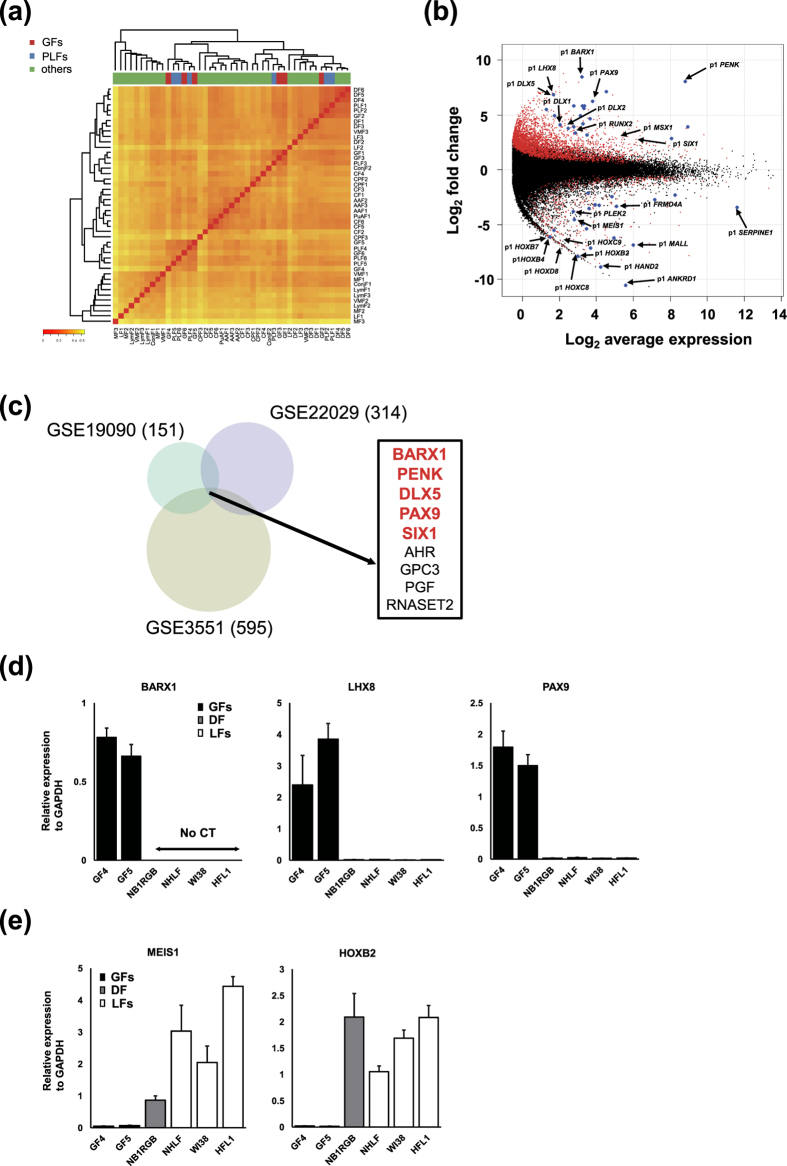
Figure 1.
(a) Hierarchical clustering analysis with all DPIs of 6 gingival fibroblasts (GFs) (red), 6 periodontal ligament fibroblasts (PLFs) (blue), and 33 other fibroblasts derived from different anatomic sites (green) by Ward’s method. The details of fibroblasts are described in Supplementary Table S1. Red to yellow color gradient of heatmap represents the degree of correlation of the indicated cell pair. (b) MA plot showing expression differences between GFs and 33 other fibroblasts. Red marks indicate promoters with significantly differential expression defined by false discovery rate (FDR) < 0.05, and blue marks indicate the genes with highly differential expression after sorting by FDR. The x-axis represents expression strength of a gene measured by CAGE tag counts and shown as average log2 counts per million. The y-axis represents fold changes of gene expression shown as log2 values. Positive fold changes indicate higher expression in GFs. (c) Venn diagram of genes with higher expression in GFs compared to other fibroblasts. The results from 3 microarray datasets were merged (GSE3551, GSE19090, GSE22029). The number of genes with higher expression in GFs (log2 fold change >1, FDR < 0.05) is indicated in parenthesis. The indicated 9 genes were common in the 3 datasets. Among them, 5 genes highlighted in red were also enriched in GFs as determined by CAGE profiling (b). (d) RT-qPCR for BARX1, LHX8, and PAX9 in GFs (black bars: GF4 and GF5), dermal fibroblasts (DF, grey bar: NB1RGB), and lung fibroblasts (LFs, white bars: NHLF, WI38, and HFL1). The expression of each gene was normalized to that of GAPDH. Bars represent mean ± SD. No CT indicates the failure to calculate Ct (cycle threshold) values due to undetectable expression. (e) RT-qPCR for MEIS1 and HOXB2 in GFs, DF, and LFs. The data is presented as in (d).

