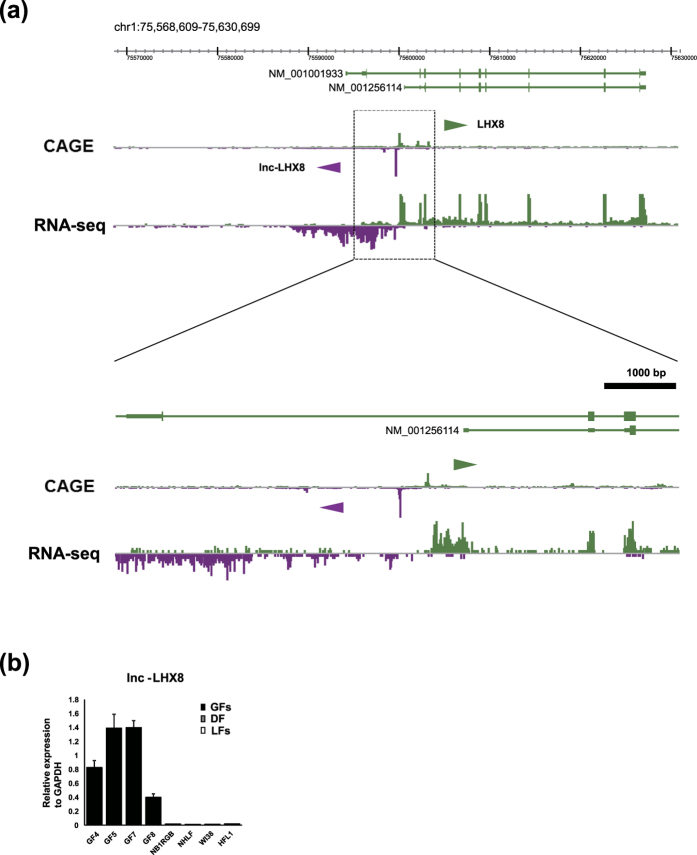
Figure 3.
(a) RNA-seq of GF8 (lower panel) and CAGE peak of GF4 (upper panel). LHX8 and neighboring ncRNAs which are specifically expressed in normal GFs were visualized by the ZENBU browser. (b) RT-qPCR for lnc-LHX8 in GFs (GF4, GF5, GF7, and GF8) and other fibroblasts (DF and LFs). The expression was normalized to that of GAPDH. Bars represent mean ± SD.

