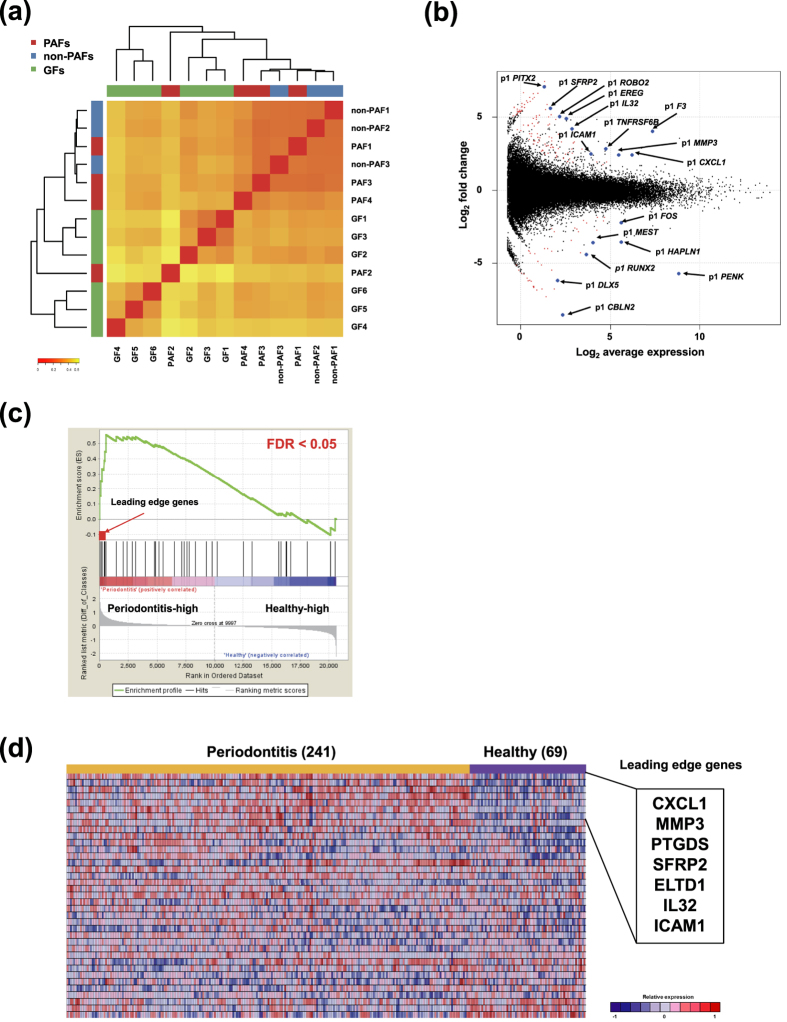
Figure 5.
(a) Hierarchical clustering analysis with all DPIs of PAFs (PAF1, PAF2, PAF3, and PAF4), non-PAFs (non-PAF1, non-PAF2, and non-PAF3), and control GFs (GF1, GF2, GF3, GF4, GF5, and GF6) by Ward method. Red to yellow color gradient of heatmap represents the degree of correlation of the indicated cell pair. (b) MA plot showing expression differences between 3 patient-matched PAFs and non-PAFs. Red marks indicate genes (p1 promoters) with significantly differential expression defined by false discovery rate (FDR) < 0.1, and blue marks indicate the genes with highly differential expression after sorting by FDR. The x-axis represents expression strength of a gene measured by CAGE tag counts and shown as average log2 counts per million. The y-axis represents fold changes of gene expression shown as log2 values. Positive fold changes indicate higher expression in PAFs. (c) Gene set enrichment analysis (GSEA) reveals the enrichment of 48 “PAF-related genes” in periodontitis tissues (n = 241) compared to healthy gingival tissues (n = 69) from GSE16134. The genes that correlated with the periodontitis and healthy phenotypes are indicated on the left (‘Periodontitis-high’) and right (‘Healthy-high’), respectively. The seven leading edge genes are indicated with an arrow. (d) Heatmap representing the relative expression levels of 37 “PAF-related genes” which could be annotated both in the CAGE and GSE16134 datasets. The seven leading edge genes identified in (c) are highlighted. Red to blue color gradient of heatmap represents the relative gene expression levels.

