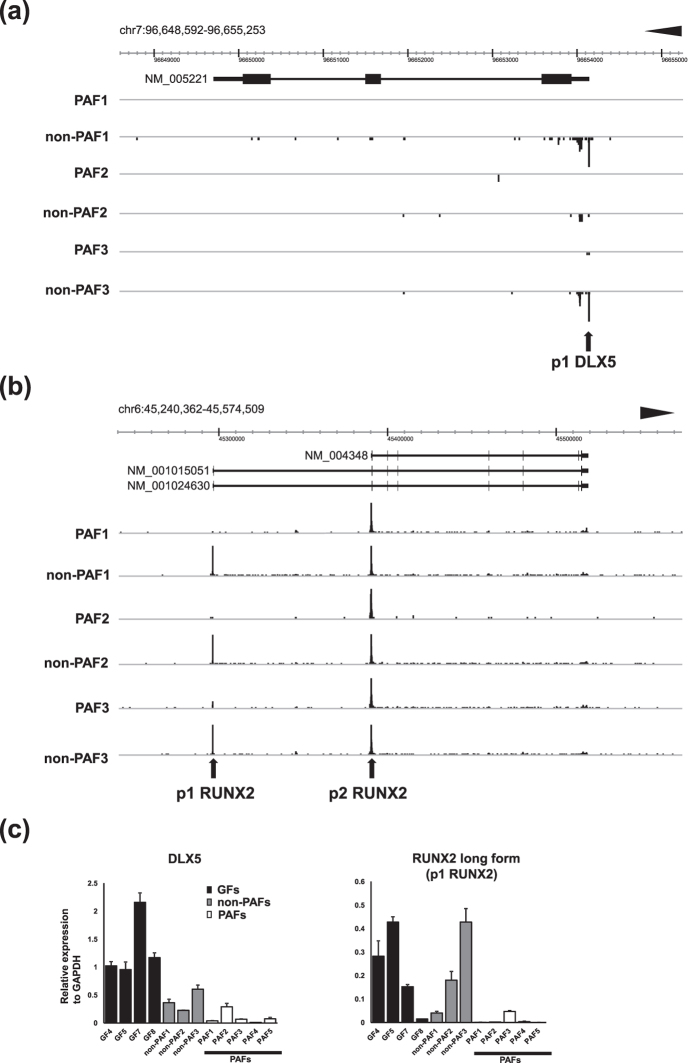
Figure 6.
(a) CAGE peaks of patient-matched 3 PAFs and 3 non-PAFs visualized by the ZENBU browser. Genomic coordinate and transcript of DLX5 registered in RefSeq (NM_005221) are shown on the top. CAGE peak for p1 DLX5 was observed in non-PAFs while absent in PAFs. (b) CAGE peaks of patient-matched 3 PAFs and 3 non-PAFs visualized by the ZENBU browser. Genomic coordinate and 3 protein coding transcript variants of RUNX2 registered in RefSeq (NM_004348, NM_001015051, and NM_001024630) are shown on the top. CAGE peaks for both p1 RUNX2 and p2 RUNX2 are detected in non-PAFs as observed in control GFs (Fig. 2(b)) while PAFs show a dominant peak for p2 RUNX2. (c) RT-qPCR for DLX5 and RUNX2 long form transcribed from p1 RUNX2 promoter. The expression of each gene was normalized to that of GAPDH. Bars represent mean ± SD. The expression levels were examined in 4 control GFs (GF4, GF5, GF7, and GF8), 3 patient-matched non-PAFs (non-PAF1, non-PAF2, and non-PAF3) and PAFs (PAF1, PAF2, and PAF3), and 2 additional PAFs (PAF4 and PAF5). Each expression was normalized to that of GAPDH. Bars represent mean ± SD.

