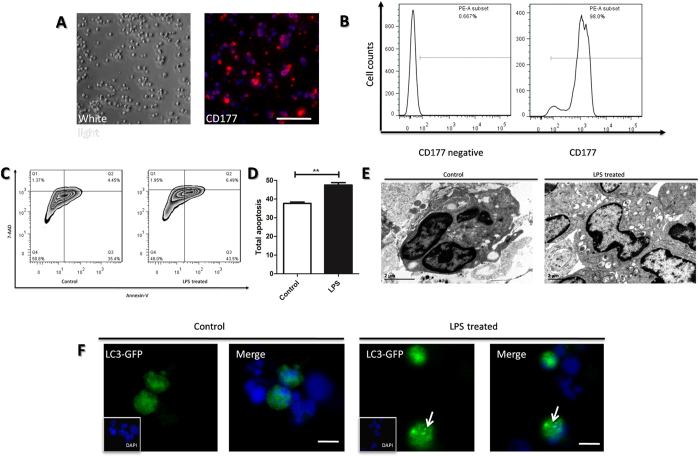
Figure 2. Assays of apoptosis and autophagy in primary-isolated neutrophils induced by LPS.
(A) The white light and immunofluorescence image of primary neutrophils isolated from mice bone marrow. The neutrophils were marked by CD177 and then incubated with Alexa Fluor® 555. The nucleus were stained by DAPI. White bar represents 50 μm. (B) The qualification of CD177 positive cells in total isolated cells of (A) were gained through single channel flow cytometry. The CD177 negative group was incubated with PBS instead of primary antibody. (C) Isolated neutrophils were treated with or without LPS (1 μg/ml) and subsequently stained with AnnexinV/7-AAD and analyzed apoptosis using MUSE cell analyzer. (D) The qualification of apoptic cells in (C). (E) Autophagysome in neutrophils treated with or without LPS assayed by transmission electron microscope. Scale bar: 2 μm. (F) The fluorescence images of GFP-LC3 puncture (which occurred upon autophagy induction, as the white arrows show). The neutrophil-like cell lines, DMSO-treated HL-60 cell lines were transfected with GFP-LC3 plasmids, treated with or without LPS (1 μg/ml) stimulation for 2 hours and observed by fluorescence microscope.The nucleus was stained by DAPI. White bar represents 10 μm.

