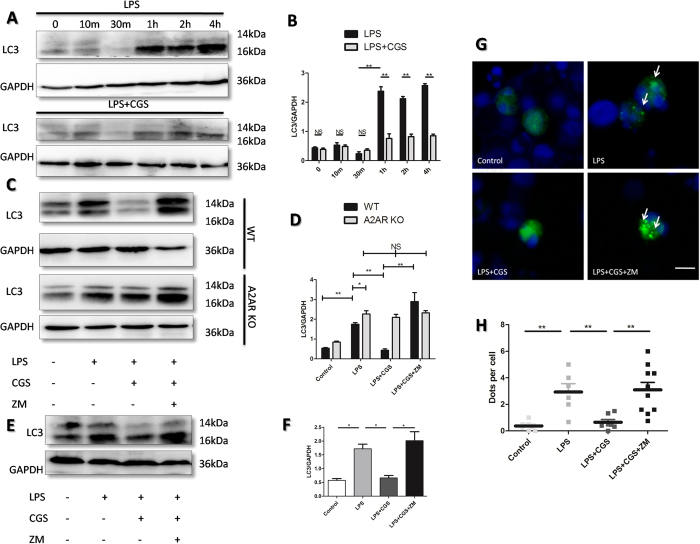
Figure 4. Identification of the role of A2AR on LPS-induced autopahgy in neutrophils.
(A) Time-dependent changes of LC3 proteins in present of LPS with or without A2AR agonist CGS21680. Primary neutrophils were treated with LPS (1 μg/ml) for indicated times. Subsequently, total proteins were extracted and LC3 were detected by WB. (B) Quantification of LC3/GAPDH in (A). (C) Effect of A2AR on LC3expressions in LPS-induced primary neutrophils. Protein lysates of primary neutrophils isolated from WT and A2AR-KO mice were analyzed by WB. The LC3 levels were detected after indicated treatments for 2 hours, of which LPS (1 μg/ml). A2AR selective agonist CGS21680 (0.1 μM) and A2AR selective antagonist ZM241385(1 μM) were used respectively. (D) Quantification of LC3/GAPDH in (C). (E) WB for LC3 in neutrophil-like cell line HL-60. The HL-60 cell lines were treated with 1.25% DMSO for 4 days to acquire a neutrophil-like phenotype and the treatment was similar to that for primary neutrophils described above. (F) Quantification of LC3/GAPDH in (E). (G) HL-60 cells transfected with LC3-GFP plasmids were dealed with indictaed treatments as primary neutrophils. Then the cells were processed with fluorescence microscope at 40 lens. White arrows demonstrate the characteristic punctuate pattern of LC3–GFP, which occurs upon autophagic induction. White bars represents 10 μm. (H) The number of LC3-GFP dots per cell counted in twenty cells per condition. The nucleus was stained by DAPI. The procedures were carried out by two independent observers with high magnification fluorescence microscope. (*p < 0.05 between the two groups; **p < 0.01 between the two groups, NS, no significant difference between the two groups, Student’s t test. All the quantification of LC3B/GAPDH in WB results are represented as mean ± SEM for three independent experiments).

