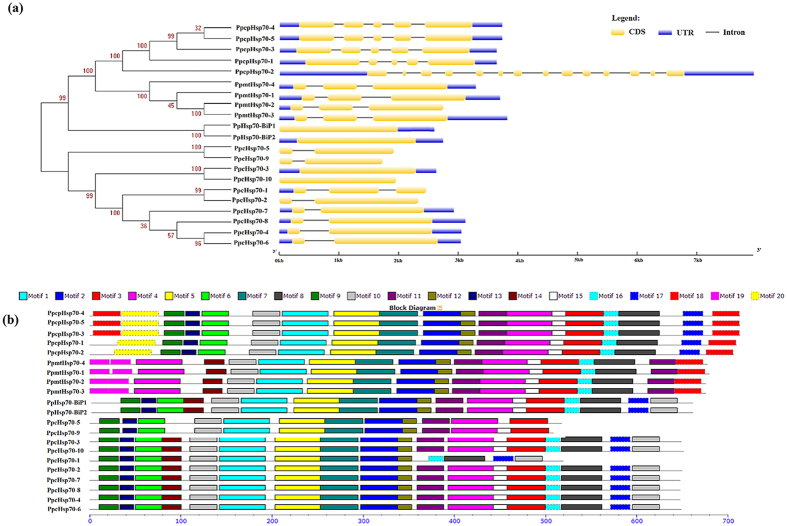
Figure 3. Phylogenetic relationships, gene structures, and motif compositions of Hsp70 superfamily members in P. patens.
(a) Multiple sequence alignment of Hsp70s from P. patens was performed using MEGA 6.06 by the NJ method with 1,000 bootstrap replicates (left panel). In the right panel, intron-exon structures of the Hsp70 genes are shown. Yellow boxes represent exons, black lines represent introns, and blue boxes represent UTR (Untranslated Regions). (b) A schematic representation of conserved motifs were presented in Hsp70 superfamily proteins. Motifs were identified by MEME software using complete amino acid sequences of Hsp70 proteins. Different motifs are represented by different colored boxes. Details of the individual motifs are in Supplementary Table S3. The protein sequences are arranged in the order shown in the NJ tree.

