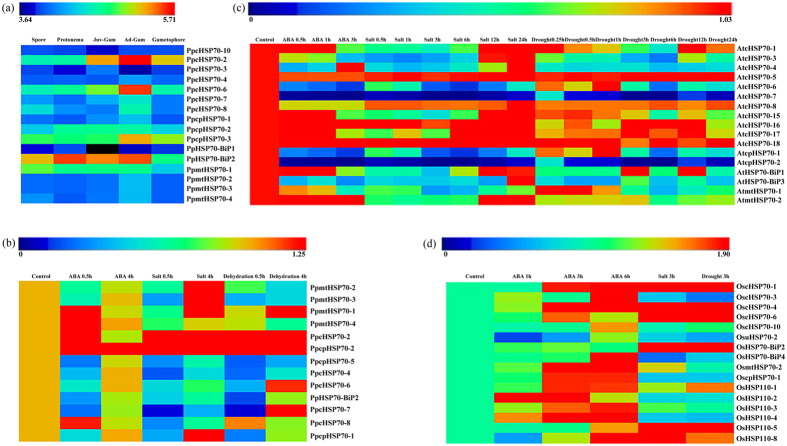
Figure 5. Hsp70 expression profiles for P. patens, O. sativa, and Arabidopsis are shown.
The Arabidopsis microarray gene expression data were obtained from AtGenExpress. The public expression data in rice were obtained from the Michigan State University (MSU) Rice Genome Annotation (http://rice.plantbiology.msu.edu) databases. The P. patens transcriptome data were obtained from Phytozome 10.3 (http://phytozome.jgi.doe.gov/pz/portal.html). (a) The heat map shows expression of Hsp70 genes in different developmental stages (spore, protonema, juvenile stage, adult stage and gametophore) according to available microarray-based data. The expression profile was generated with log-transformed average values (b) P. patens Hsp70 superfamily genes expression under ABA (0.5 h and 4 h), salt (0.5 h and 4 h) and dehydration treatment (0.5 h and 4 h). (c) Arabidopsis Hsp70 superfamily genes expression under, ABA (0.5 h, 1 h and 3 h), salt (0.5 h, 1h, 3 h, 6 h, 12 h and 24 h), drought treatment (0.25 h, 0.5 h, 1h, 3 h, 6 h, 12 h and 24 h). (d) Rice Hsp70 superfamily genes expression under ABA (1 h, 3 h and 6 h), salt (3 h), and drought (3 h) treatment. The expression profile of (b–d) was generated with the fold changes using the average values for each treatment divided by the values of the control.

