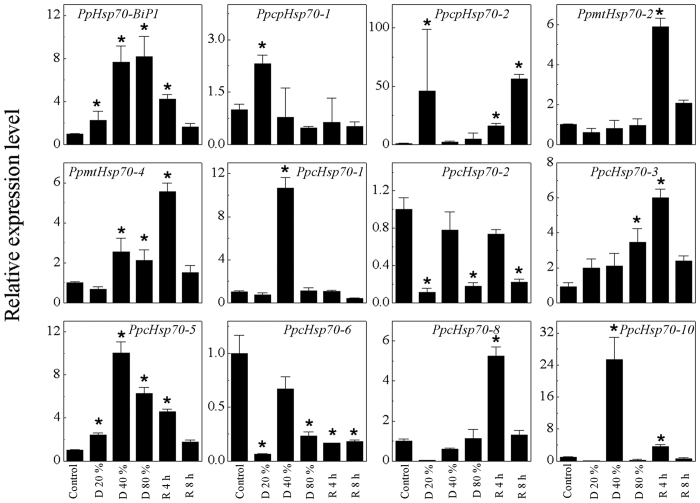
Figure 6. Relative normalized expression of P. patens Hsp70 superfamily genes during treatment with dehydration stress and rehydration.
The line-chart shows relative expression of Hsp70 genes at different points during treatment with dehydration stress and rehydration, as monitored by RT-qPCR (with Actin as control). Control, P. patens gametophores with no treatment; D 20%, P. patens gametophores air-dried to 20% water loss; D 40%, P. patens gametophores air-dried to 40% water loss; D 80%, P. patens gametophores air-dried to 80% water loss; R 4 h, D 80% P. patens gametophores re-watered for 4 h; R 8 h, D 80% P. patens gametophores re-watered for 8 h. There were five replicates for each treatment, and the experiment repeated at least three times. Values are mean ± S.D, n = 5. An asterisk indicates that the value of treatment is different from control (p < 0.05).

