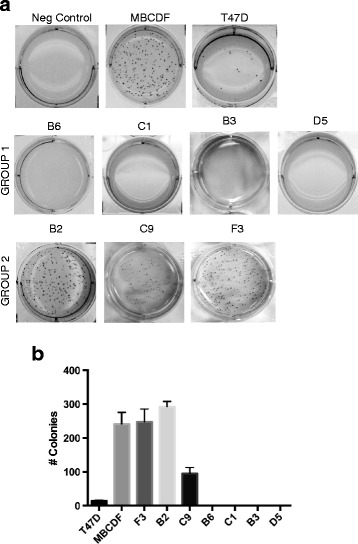
Fig. 4.

Colony formation of MBCDF’s subpopulations on soft agar. Anchorage-independent cell growth of B3, B6, C1, D5 (Group 1), B2, C9, and F3 (Group 2) subpopulations was evaluated by soft agar assay. A bottom layer of 0.5 % of agar in RPMI plus 10 % FBS was placed. The top layer contained 0.35 % agar in RPMI plus 10 % FBS and 2500 cell/plate. Colonies were analyzed after 15 days of culture. MBCDF and T47D were used as positive controls of colony formation. Agar without cells was used as negative control. a Representative picture of colony formation of each subpopulations are presented. b Cells were photographed and counted. The graph represents the mean ± SEM. Soft agar assay was performed three independent times in triplicate
