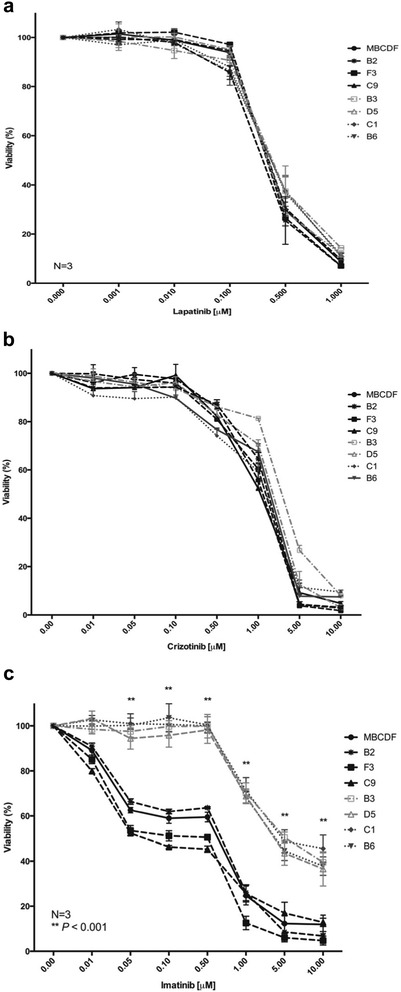
Fig. 6.

Effect of Lapatinib, Crizotinib and Imatinib on cell viability of MBCDF’s subpopulations. B2, F3, C9 (Group 2), B3, D5, C1, B6 (Group 1) were seeded as in Fig. 5. a Lapatinib was used at the following concentrations: 0, 0.001, 0.01, 0.1, 0.5 and 1 μM. b Crizotinib was added at 0, 0.01, 0.05, 0.1, 0.5, 1, 5 and 10 μM. c The following concentrations were used for Imatinib: 0, 0.01, 0.05, 0.1, 0.5, 1, 5 and 10 μM. Cell viability was evaluated as in Fig. 5. Data represent the mean ± SEM of three independent experiments seeded in triplicate. **P < 0.001
