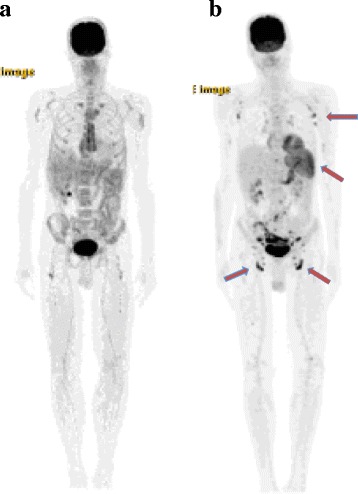
Fig. 2.

Maximum intensity projection images of two whole-body 18 F-FDG PET/CT studies. Panel a shows the PETCT from 11/20/15, early in the course of immunotherapy. Panel b shows the PET/CT from 2/11/16, after completion of induction ipilimumab/nivolumab. Arrows indicate the increased metabolic glucose consumption in bilateral inguinal, iliac, axillary lymph nodes as well as the spleen, highly suggestive of immune activation
