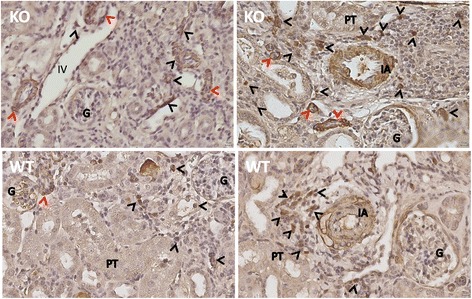
Fig. 8.

An association of CLU deficiency with more positivity in α-SMA stain. The expression of α-SMA (a myofibroblast marker) in the sections of CLU null and WT kidneys, harvested after 30 days of IRI, was examined by using a routine immunohistochemical method. Data were a typical microscopic view of the renal cortex in each group (KO: CLU KO kidneys; WT: WT kidneys), showing dark brown stain of α-SMA-expressing cells in the tubulointerstitial area and tubular epithelium, inside the glomerulus and interlobular arterial wall, and in the perivascular space. G: glomerulus; PT: proximal convoluted tubule; IA: interlobular artery; and IV: interlobular vein. Black arrows: infiltrating α-SMA+ cells; red arrows: tubular α-SMA+ cells
