
Fig. 1.
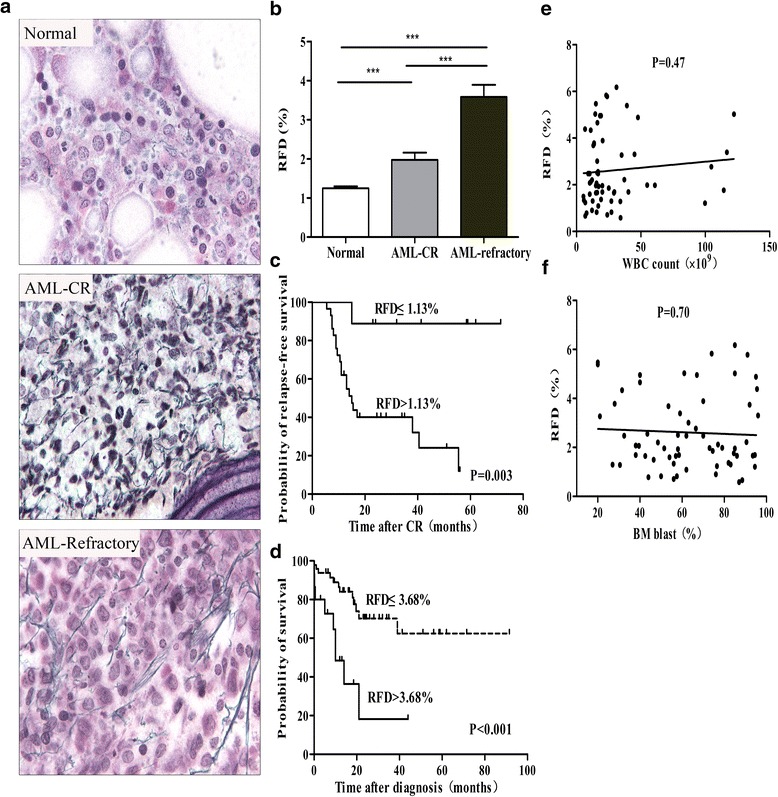
The RFD score is higher in AML and is related to outcome. a Examples of the Gomori staining of reticulin fibers in the BM sections from normal controls and AML patients, which were further divided into CR and refractory groups. Both images are at a magnification of 1000×. b The RFD for the AML-CR (n = 38) and AML-refractory (n = 25) patients compared to the normal controls (n = 59), *** p < 0.001 (c) RFS of AML-CR patients subdivided into high (>1.13 %) and low (≤1.13 %) RFD groups, P = 0.003. d OS of all the AML patients subdivided into high (>3.68 %) and low (≤3.68%) RFD groups, P < 0.001. e-f Scatter plot: RFD vs. blasts in the peripheral blood and the blasts in the BM of primary AML patients using linear regression analysis (P = 0.47 and 0.70 respectively)