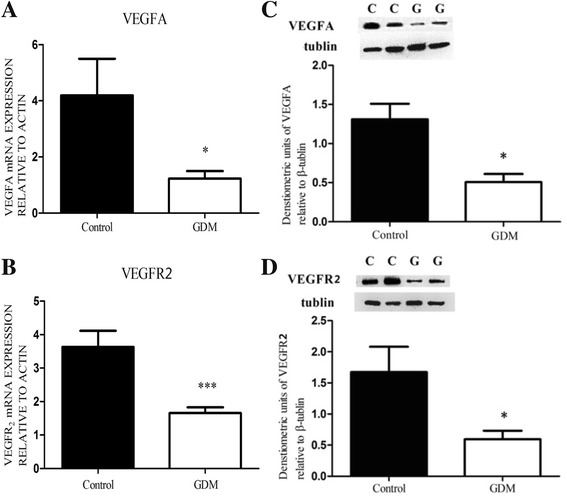
Fig. 3.

Expressions of VEGFA and VEGFR2 mRNAs and proteins in GDM (n = 20) and control (n = 20) placental tissues by real-time PCR and Western immunoblotting. Relative quantification of VEGFA (a) and VEGFR2 (b) mRNA expression normalized to the expression of ACTIN in all the samples. Data were analyzed according to the 2–ΔΔCT method. A representative immunoblots for VEGFA (c) and VEGFR2 (d) were shown. Immumoblots representing β-tubulin protein (middle panels) showed the loading equally total protein (25 μg). Semi-quantitative analyses of VEGFA and VEGFR2 immunoreactive proteins were performed relative to β-tubulin (bottom panels). The Y-axis represents the expression levels of VEGFA and VEGFR2 related to actin or tubulin. *P < 0.05, **P < 0.01, Student’s t test
