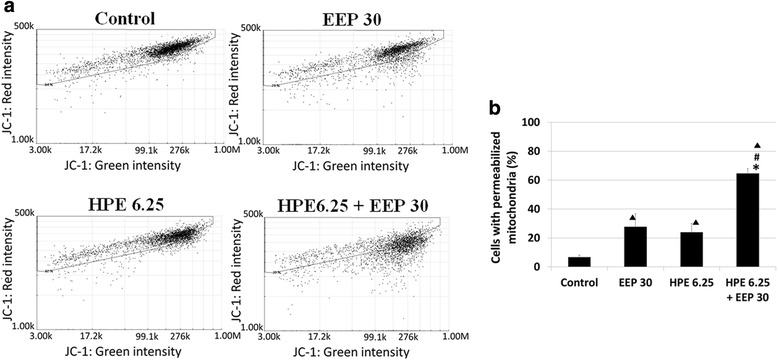
Fig. 4.

Mitochondrial membrane permeabilization in U87MG cells after treatment with EEP, HPE and their combination. Legend: Mitochondrial membrane permeabilization after treatment (24 h) with EEP (6.25 μg/mL), HPE (30 μg/mL) and combination of EEP (30 μg/mL) with HPE (6.25 μg/mL) in U87MG cells (a). Data is shown in percentage of permeabilized cells compared to control (b). Significant changes (p < 0.05): ▲EEP; HPE; EEP with HPE vs Control; *HPE vs HPE with EEP; #EEP vs HPE with EEP
