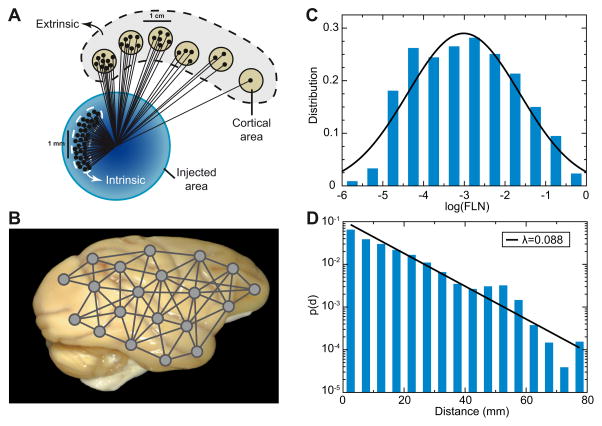
Figure 1.
Inter-areal connections of macaque monkey cortex. (A) A retrograde tracer is injected in a (target) area, and relative weight of connection between a source area and the target area is quantified by the fraction of labelled neurons (FLN), which is the number of labelled neurons in the source area divided by the total number of labelled neurons. (B) The analysis is carried out with a number of cortical areas, leading to a weighted- and directed- inter-areal network connectivity. (C) FLNs span five order of magnitudes and are fit by a lognormal distribution. (D) FLN between a pair of cortical areas is an exponential function of their distance, with the characteristic distance length of ~ 11 mm. Adapted with permission from [1••].

