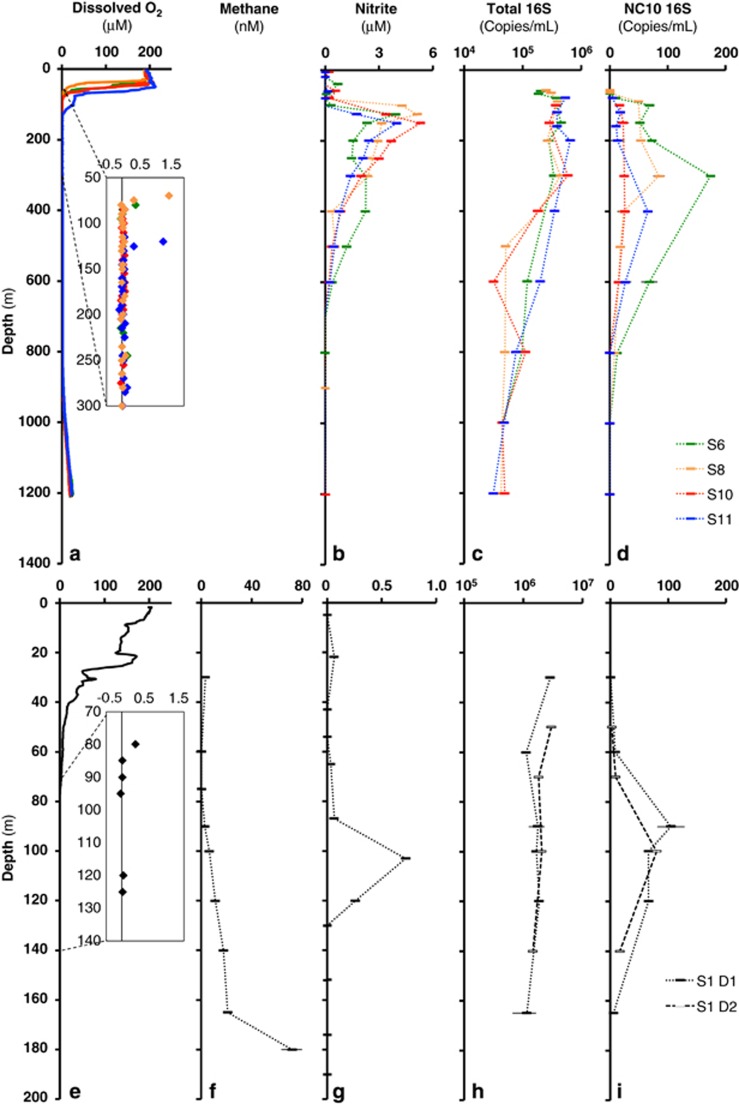
Figure 1.
Water column chemistry and microbial biomass in the ETNP OMZ in May 2014 (a−d) and GD OMZ in January 2015 (e−i). ETNP stations (colors) span a nearshore (S6) to offshore (S11) gradient (Supplementary Figure S1). (a, e) Dissolved oxygen, based on standard oceanographic Clark type O2 electrodes with an inset showing higher resolution STOX sensor measurements. (f) Methane. (b, g) Nitrite. (e–i) Total (c, h) and NC10-specific (d, i) 16S rRNA gene counts, based on quantitative PCR analyses of the 0.2–1.6 μm biomass fraction. Data from the ETNP reflect discrete collections (per depth) using a CTD/rosette or a pump-profiling system during mid May 2014. Data from GD reflect discrete collections (per depth) using a hand-deployed Niskin bottle on 21 January 2015 (D1), with additional samples for 16S counts obtained on 23 January (D2). Error bars are standard deviations among replicates (duplicate and triplicate water samples from the same cast for [CH4] and [NO2-], respectively; triplicate qPCRs for 16S counts). [O2] data are provided for representative casts at each station. Challenges in calibration prevented accurate [CH4] measurements in the ETNP (see text).

