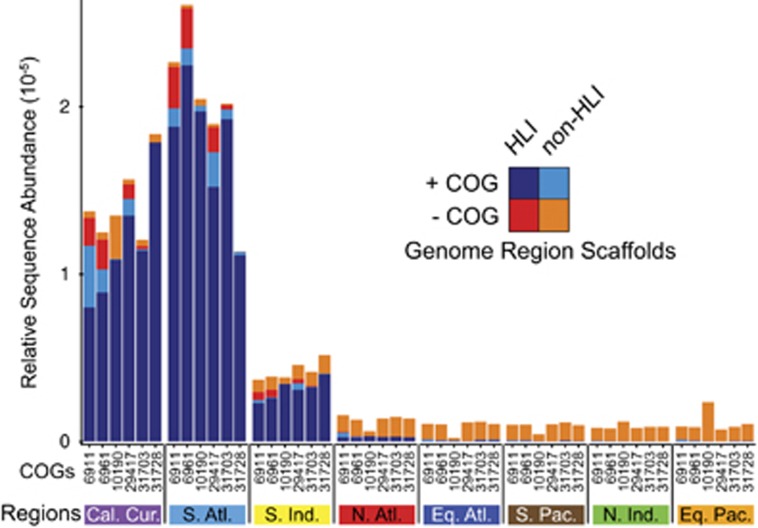
Figure 4.
Distribution of sequences making up metagenomic assemblies with and without lower-temperature genes. The corresponding sequenced reads for each cold temperature gene were mapped to metagenomic assemblies comprised of pooled sequences from the entire data set (+COG). The two closest neighboring genes were then identified on each metagenomic assembly and used to find assemblies without the lower-temperature gene. Sequences on each of these sets of assemblies, with (+COG) and without (−COG) the cold temperature gene, were distributed across regions. Sequences were additionally subdivided based on sequence similarity to HLI genomes (+HLI) or not (−HLI).

