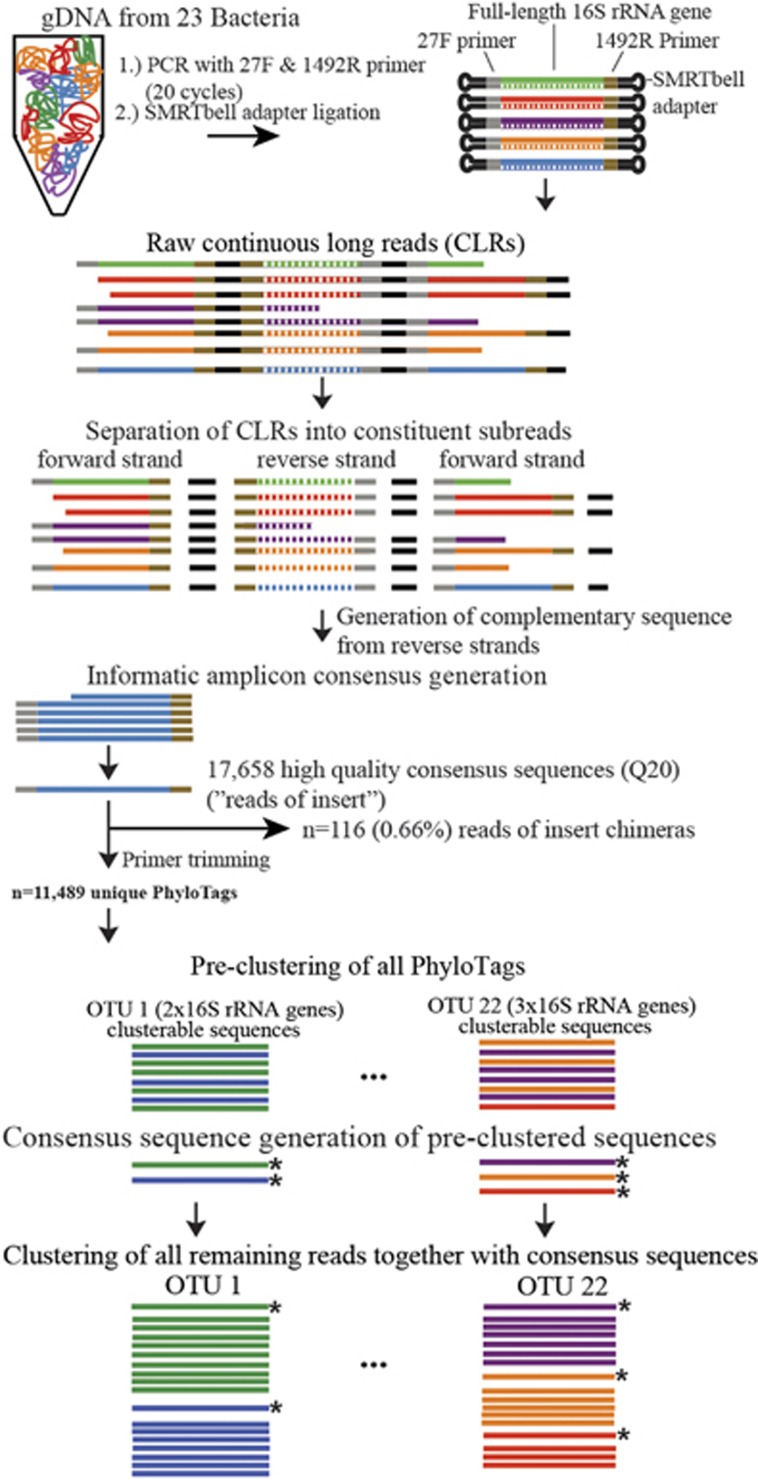
Figure 1.
Workflow of the PhyloTag sequence generation and cluster analysis pipeline with results from one of the five mock community replicate data sets (more details in Supplementary Figure 1). A simulated FL 16S rRNA gene read data set generated from the 23 genomes of the selected bacterial species was used to optimize the clustering steps in the pipeline (see Materials and methods section). Detailed processing steps for iTag and shotgun sequences are illustrated in Supplementary Figure 1.

