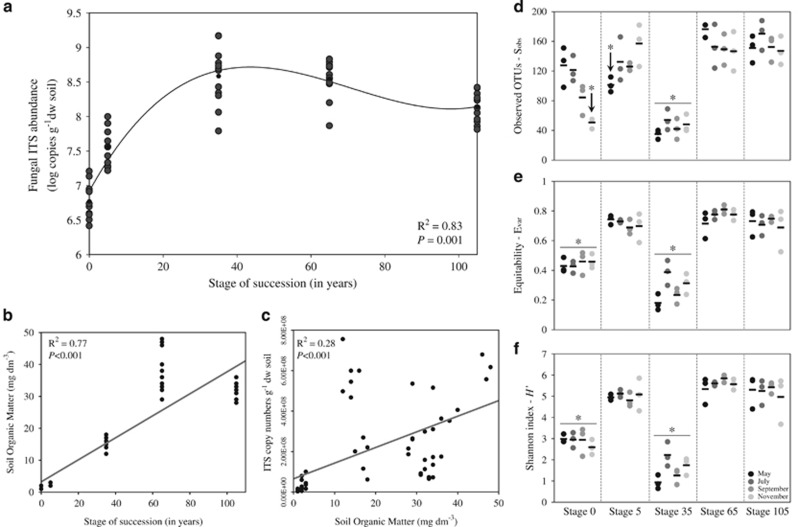
Figure 1.
Fungal ITS copy abundance and α-diversity in the salt marsh chronosequence. (a) Cubic regression of fungal ITS abundances along the chronosequence—abundances are indicated by log copy numbers of the ITS region of the fungal rRNA gene per g of dry weight soil, using quantitative PCR. (b, c) Linear regressions displaying the increments in SOM along the salt marsh chronosequence (b), and the relationship between SOM and fungal ITS abundance (c). Statistics are provided on the panels. (d–f) Distributions of α-diversity measurements according to sampling time across successional stages: (d) observed OTUs (Sobs), (e) equitability—(Evar) and (f) Shannon index (H'). Comparisons of α-diversity across stages were carried out by nonparametric t-tests with 999 Monte Carlo permutations (P<0.001).

