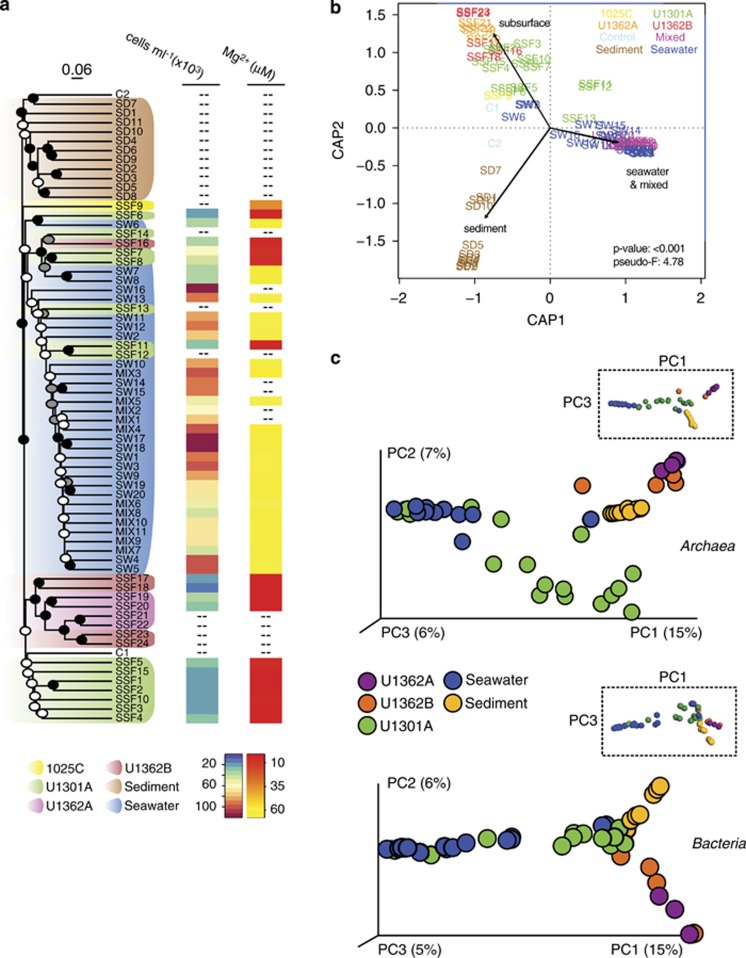
Figure 2.
Mid-ocean ridge flank basement fluids harbor a distinct microbial assemblage. (a) Dendogram depicting relationships between subsurface fluid samples and nearby sediments, seawater and controls. The tree shown was the first replicate tree constructed with the UPGMA algorithm from Bray–Curtis dissimilarity indices calculated using unique unpaired forward Illumina tag reads and rarefying to an even sequence depth across samples (6108 reads). Support for nodes on the dendogram was determined by analysis of 100 UPGMA replicate dendograms constructed from randomly generated rarefied libraries (6108 reads) and is indicated by black (100%), gray (>80%) and white (>50%) circles. The scale bar corresponds to a Bray–Curtis dissimilarity value of 0.06. Where available, microbial cell abundances and magnesium concentrations are indicated for each sample. (b) Distance-based redundancy analysis showing grouping of samples based on the categories ‘subsurface', ‘sediment', ‘seawater' and ‘mixed'. (c) PCoA of Bray–Curtis dissimiliarity indices using rarefied unique paired Illumina tag reads representing the domains Archaea and Bacteria. Rarefaction of archaeal sequences was performed to the lowest number of sequences detected in the subsurface fluid samples (190 reads) and excluded samples C1, C2, SW6 and SW8. Rarefaction of bacterial sequences was performed to the lowest number of sequences (2803 reads) represented in a single sample. Low-quality subsurface samples are not shown. Plot axes are scaled according to the percentage variation explained via the top three principal components. Rotated plots highlighting P1 versus P3 are shown inset to reveal additional features.

