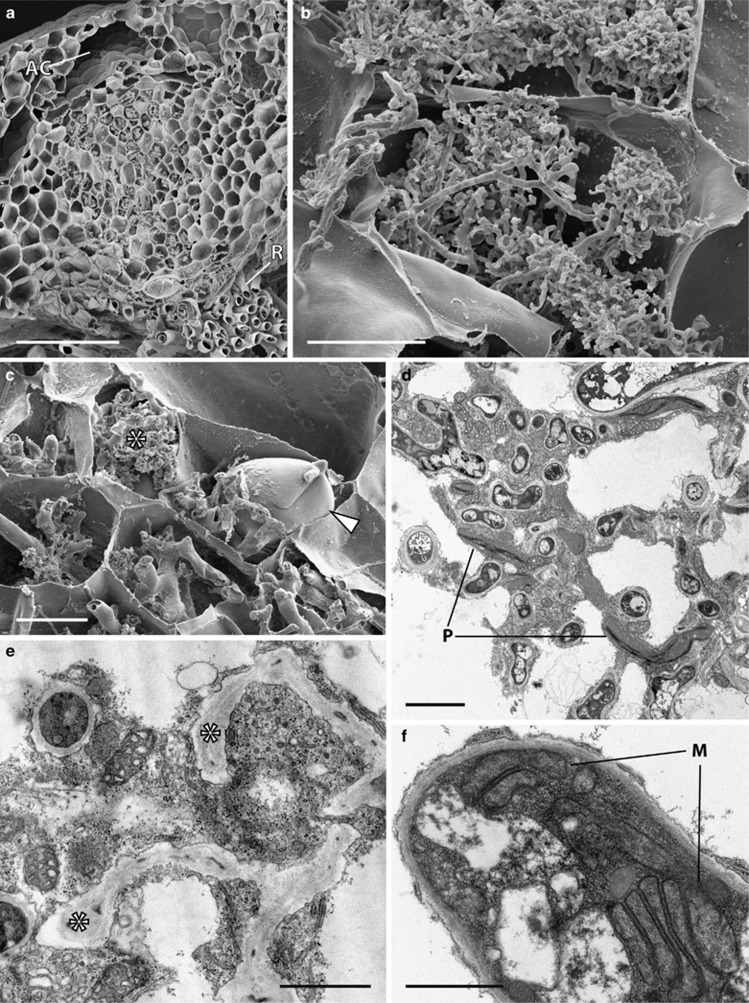
Figure 5.
Cytology of Neohodgsonia mirabilis grown at 440 and 1500 p.p.m. a[CO2]. Scanning (a–c) and transmission (d–f) electron micrographs (TEM). Both the distribution and cytology of the association remained the same between a[CO2] treatments and are illustrated here in plants grown at 440 p.p.m. a[CO2]. (a) Fungal colonization zone extending from the rhizoid (R) bearing ventral surface of the thallus to just below the dorsal air chambers (AC). (b, c) Young arbuscules (b) and collapsed ones (c) (*) adjacent to a large vesicle (arrowed). (d) fungal hyphae surrounded by active host cytoplasm. Note the plastids (P) with well-developed thylakoid systems but largely devoid of starch. (e) Degenerated arbuscular hyphae (*) surrounded by healthy host cytoplasm. (f) Fungal hyphae typically contain multiple mitochondrial stacks (M). Scale bars: (a) 200 μm; (c) 50 μm; (b) 20 μm; (d) 3 μm; (e, f) 1 μm.

