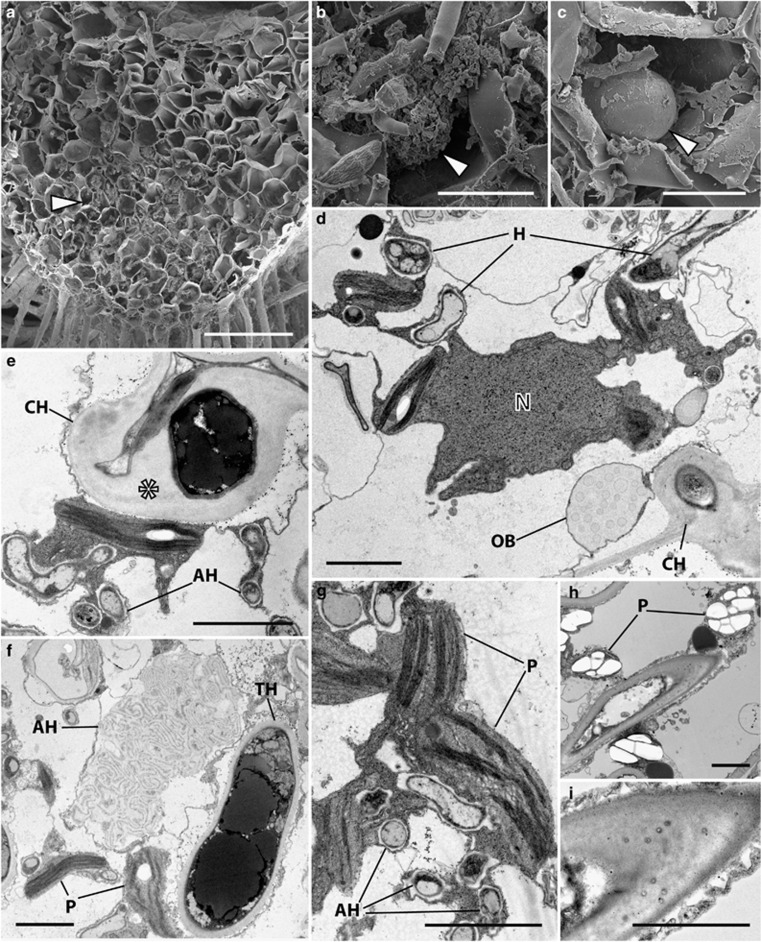
Figure 6.
Cytology of Allisonia cockaynei grown at 440 and 1500 p.p.m. a[CO2]. Scanning (a–c) and transmission (e–i) electron micrographs (TEM). There was no change in the overall distribution of fungal colonization and in the cytology of the fungus between [CO2] treatments, both illustrated here in plants grown at 440 p.p.m. a[CO2] except for panels (h and i). (a) Fungal colonization zone (arrowed) occupying the first 10 cell layers from the rhizoid-bearing ventral surface. (b) Collapsed arbuscules (arrowed) and (c) large vesicle (arrowed). (d) Host cell with active cytoplasm in close association with fungal hyphae (H). Note the colonizing hypha (CH) traversing the host cell wall. N, nucleus; OB, oil body. (e) colonizing hypha with thick layer of fibrillar material (*) in between the fungus cell wall and the host plasma membrane (arrowed) and thin-walled arbuscular hyphae (AH) in close proximity to plastids (P). (g) Arbuscular hyphae in close association with starch-free plastids. (h) In plants grown at 1500 p.p.m. a[CO2] plastids have prominent starch deposits. (i) Plasmodesmata-like channels are present in the fibrillar material that surrounds the colonizing hyphae. Scale bars: (a) 200 μm; (b, c) 20 μm; (d–i) 3 μm.

