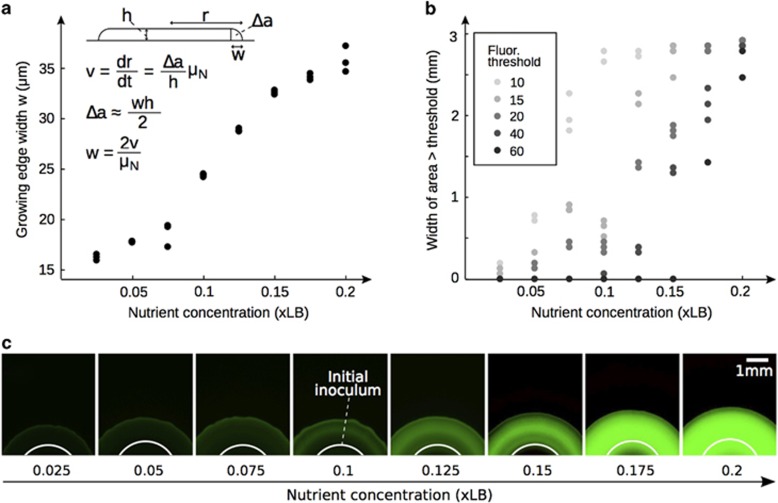
Figure 3.
Estimating the width of the growing edge. (a) Growing edge width w estimated from the radial expansion velocity v (or dr/dt) and the maximum growth rate μN, measured at different nutrient concentrations in liquid (see Materials and methods, Supplementary Figure S6B): w=2v/μN, where the cross-section of the growing edge Δa is approximated to a triangle. Because v increases with nutrient concentration (see Figure 2b), so does w. (b) Image analysis of rrn colonies on day 7, showing the width of the radius of each colony that was above a given fluorescence threshold. Because at some thresholds many colonies were either never above or always above the threshold, multiple thresholds are shown. All data show an increase in growing edge width with nutrient concentration. (c) Fluorescence microscopy images of rrn colonies at increasing nutrient concentration at fixed exposure on day 7. The green channel brightness was enhanced equally for all images to improve visualization.

