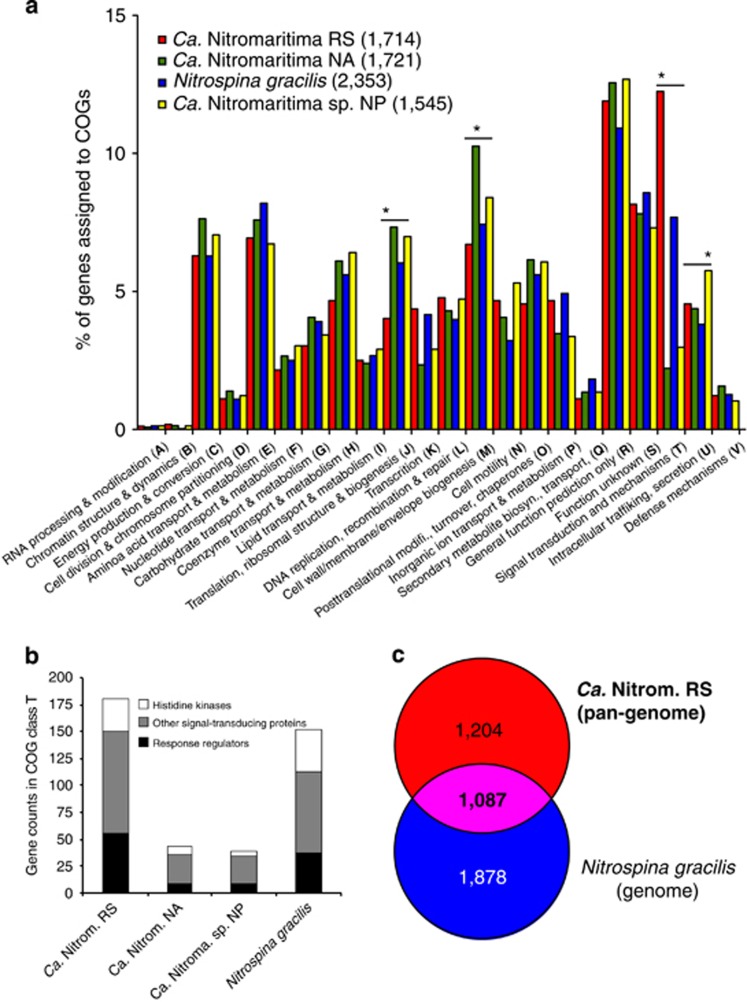
Figure 4.
Comparative (pan)-genome analysis of the three geographical separated Ca. Nitromaritima SAGs and Nitrospina gracilis. (a) Enriched or under-represented clusters of orthologous genes (COGs) in each (pan)-genome with significantly different COGs denoted by an asterisk above the bars. The total gene counts assigned to COGs in each (pan)-genome are shown in brackets. (b) Illustrates the over-representation of COGs in class T in Ca. Nitromaritima RS and N. gracilis. (c) The size of the ‘core' genome (in bold) and unique gene sets of the RS-SAGs pan-genome (Ca. Nitromaritima RS) and the genome of N. gracilis.

