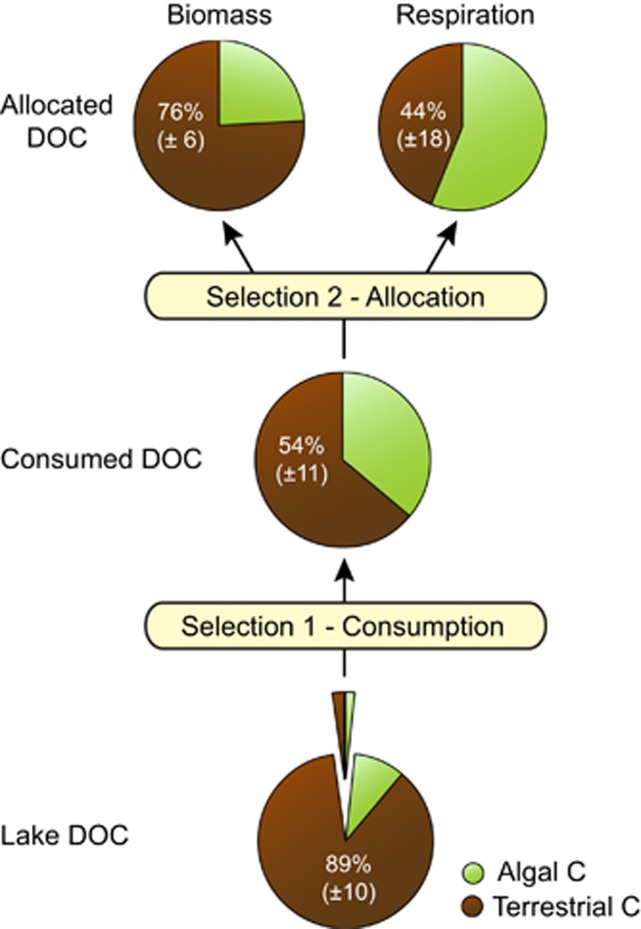
Figure 3.
Proportion of algal (green) and terrestrial (brown) C in the consumed DOC pool, bacterial biomass and respiratory CO2. The diagram depicts the preferential consumption of algal vs terrestrial DOC (Selection 1) and the further allocation of the C sources to the respiration and biomass synthesis (Selection 2) in lake bacterioplankton. The terrestrial contribution to each component is derived from a δ13C, two-source (algal and terrestrial) mixing model (see Materials and methods). The average proportion was estimated in 10 of the 12 temperate lakes of southeastern Québec for which all comparative data were available, and is shown along with ±1 s.d. in brackets.

