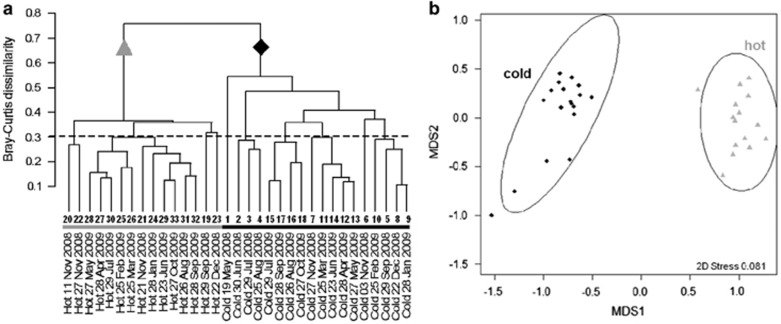
Figure 5.
Comparison of Legionella community composition in hot and cold drinking water by using different statistical approaches. (a) Dendrogram based on a Bray-Curtis distance matrix of untransformed abundance values of individual PTLs as shown in Figure 3. Cold water communities (black diamonds) are substantially different from the hot water communities (grey triangles). (b) Ordination plot obtained by NMDS of PTL abundance and phylogenetic distances between phylotypes (here: mean nearest taxon distance, mntd, see Materials and methods).

