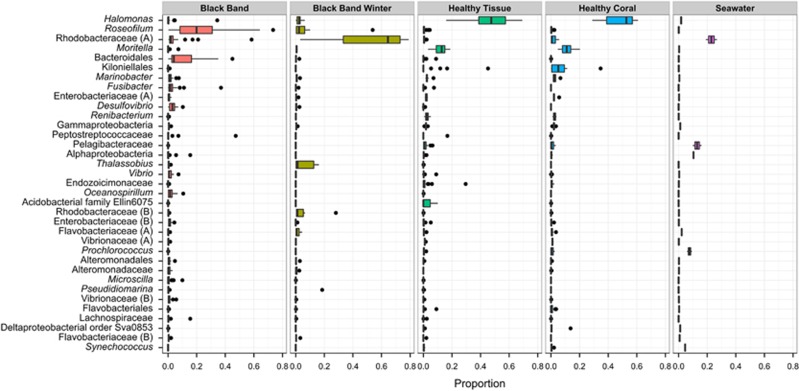
Figure 2.
Distribution of abundant bacterial genera in healthy and diseased coral microbiomes. Box and whisker plot of the relative proportion of sequencing reads assigned to 35 most abundant bacterial taxa of surface microbiomes from corals with BBD (n=23), with BBD in winter (n=7), in healthy tissue on corals with BBD (n=20), in healthy coral heads (n=10), and in comparison with seawater above the reef (n=2). Points outside of the box and whiskers represent data outliers. Taxa were classified to genus when possible; taxa labeled with higher taxonomic classifications did not match named lineages within the database. Families labeled ‘(A)' or ‘(B)' represent separate lineages, which were not classified to more specific levels and match taxa labels in Figure 4 and Supplementary Figure S1.

