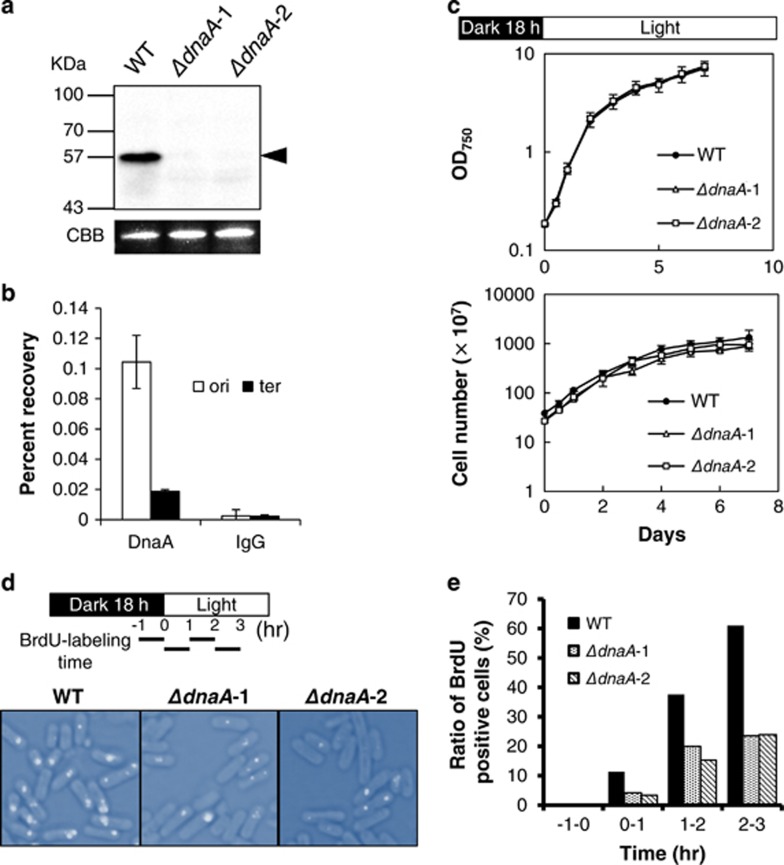
Figure 1.
Deletion of dnaA reduces DNA replication initiation frequency but not growth in S. elongatus. (a) Analysis of DnaA expression by western blotting. (b) DnaA binding at oriC and ter was evaluated by chromatin immunoprecipitation using an anti-DnaA antibody and quantitative PCR to amplify oriC and ter regions. (c) Cell growth at the stationary phase; OD750 (upper) and cell number (lower) were measured. (d) Schematic representation of culture conditions and the BrdU labeling period. Cells were labeled with BrdU for 1 h at each time point, as indicated by bars (BrdU labeling time). BrdU-labeled cells at 2–3 h after synchronization are shown in merged bright-field and immunofluorescence images. (e) Quantitative analysis of BrdU-positive cells. Total and BrdU-positive cell numbers are as follows: WT: −1 to 0 h=376, 0 to 1 h=451, 1 to 2 h=362, 2 to 3 h=471; dnaA1: −1 to 0 h=453, 0 to 1 h=441, 1 to 2 h=429, 2 to 3 h=422; dnaA2: −1 to 0 h=482, 0 to 1 h=391, 1 to 2 h=423, 2 to 3 h=438, respectively.

