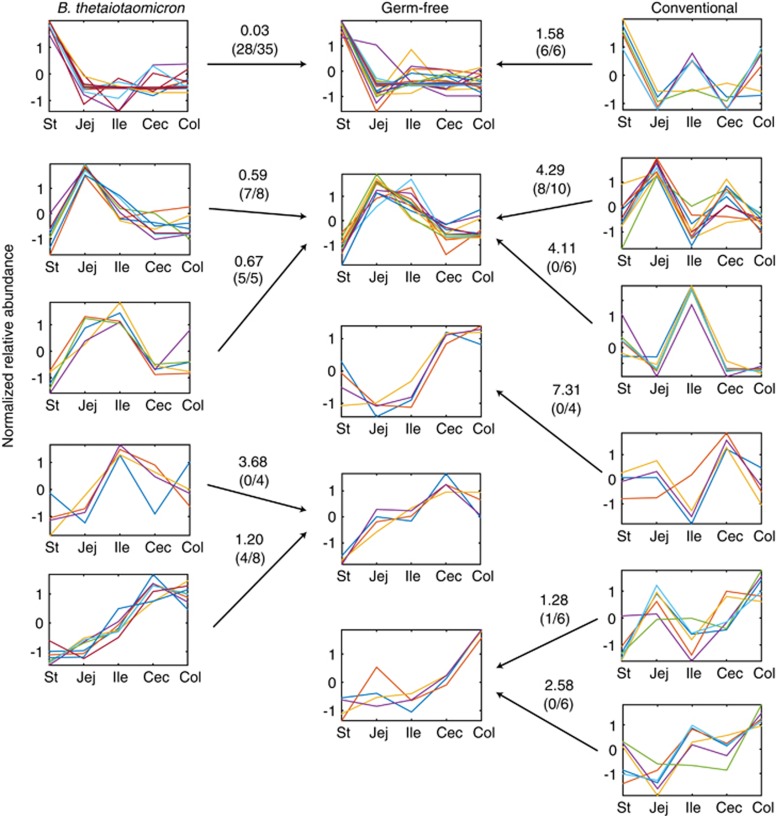
Figure 3.
K-means clustering reveals distinct patterns of protein abundance along the GI tract. K-means clustering (Materials and methods) on z-score-normalized, highly abundant proteins for six clusters in data from CR samples and five clusters in data from GF and BT samples. Numbers associated with arrows are the squared Euclidean distance and the number of proteins in common between the non-GF cluster (BT or CR) and the indicated GF cluster. For example, 28 of 35 proteins in the top BT cluster were found in the top GF cluster and collectively indicated a squared Euclidean distance of 0.03. St, stomach; Jej, jejunum; Ile, ileum; Cec, cecum; Col, proximal colon.

