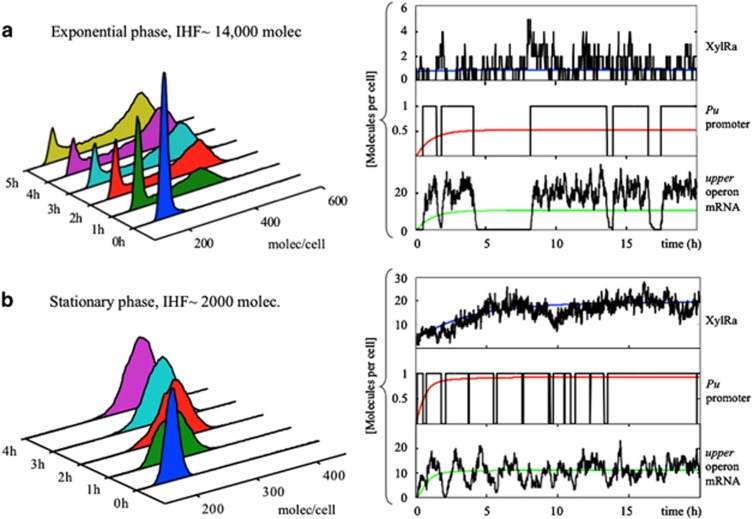
Figure 5.
Effect of IHF levels in response variability. (a) Simulation of increasing intracellular IHF levels in exponential phase to the concentration present in stationary conditions (~14 000 molecules). Distributions remain bimodal (left panel) and Pu promoter dynamics exhibits slow fluctuations (right panel). (b) Simulation of decreasing IHF levels in exponential phase to those of exponential conditions (~2000 molecules). The population distributions of GFP are still unimodal (left panel) although noise increases, due to larger fluctuations in Pu mRNA (right panel).

