Figure 2.
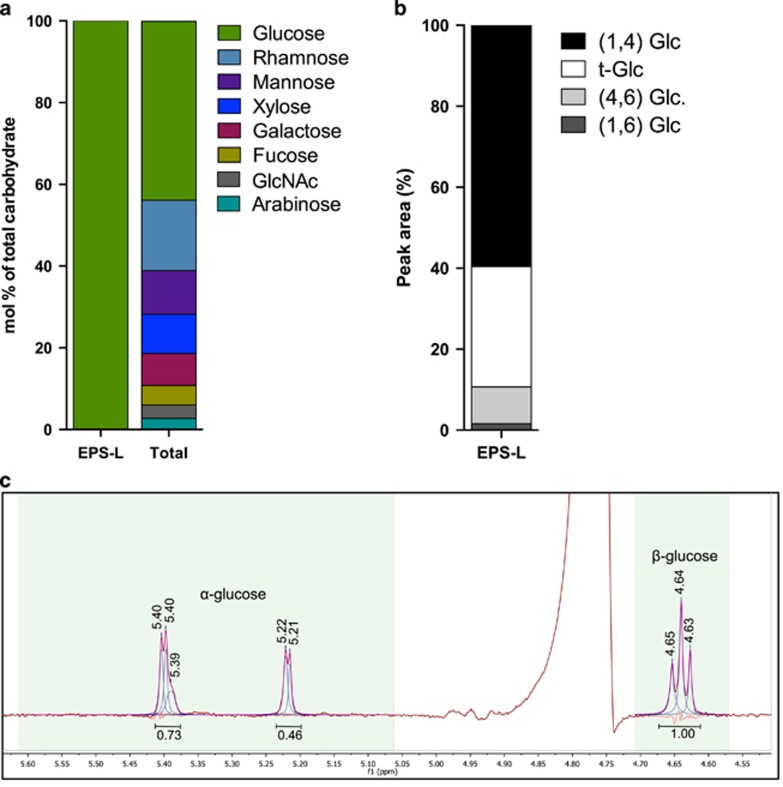
Carbohydrate composition analyses for ES mat EPS-L fraction. (a) Glycosyl composition analysis of one replicate for each EPS-L and Total fractions. ‘GlcNAc' is N-acetylglucosamine. (b) Linkage analysis of EPS-L from one ES mat sample, showing the types of pyranosides detected. ‘Glc' is glucose and ‘t-Glc' is a terminal glucose linkage. (c) Anomeric portion of the 1D-1H NMR spectra of EPS-L from one ES mat sample showing the regions used for line fitting. Numbers under peaks are integrated area under curve.

