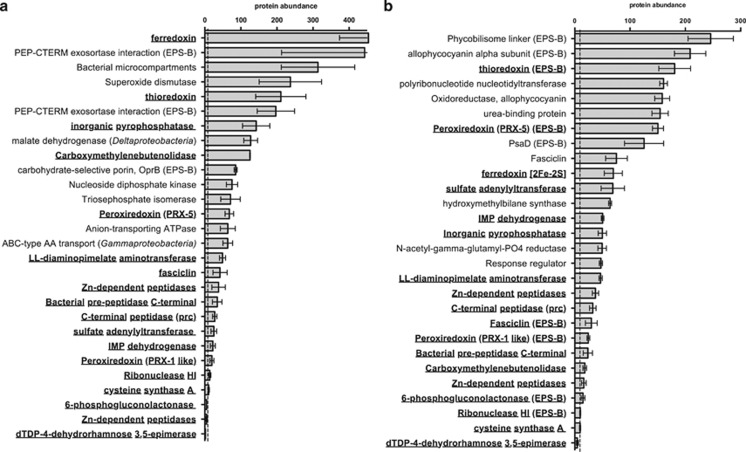
Figure 4.
Homologous and abundant exoproteins identified in each (a) ES mat and (b) cultured biofilm exoproteomes. Protein abundance values are average normalized spectral counts over triplicate biological replicates (error bars represent 1 s.d.). All homologs enriched in ES mat and cultured biofilm exoproteomes with predicted functions are included and indicated in bold. Also included are the top seven most abundant proteins in the EPS-L fraction and top three in the EPS-B fraction. Exoproteins are enriched in EPS-L unless indicated by (EPS-B) following the name and are of cyanobacterial origin unless indicated. Dotted line indicates median protein abundance in each set of samples.

