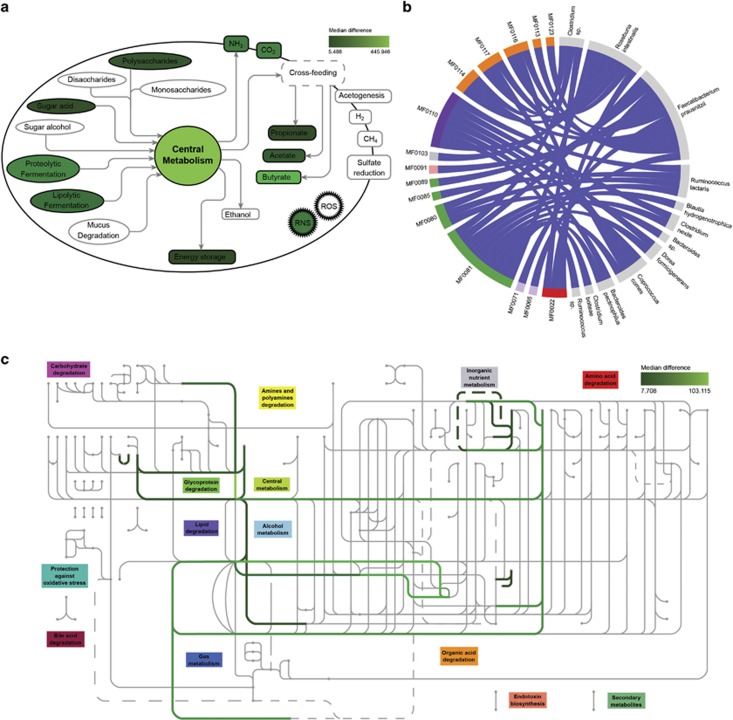
Figure 1.
GOmixer analysis outcome of Erickson et al. (2012). (a) Global gut metabolic processes map that gives an overview of the major metabolic processes in the gut. The color scale reflects significantly enriched abundances in Healthy compared to Crohn's Disease (CD) subjects. (b) Chord plot highlighting species-function associations. Modules (MF numbers) belonging to the same global metabolic process share the same color. Association links reflect module over/under-representation in Healthy (blue) or CD (red). In this analysis all functions are over represented in Healthy. (c) Gut module map consisting of modules connected by their input and output compounds. They are clustered according to their hierarchical classification (for example, amino-acid degradation) and reflect the flow of compounds from top to bottom. The color scale reflects significantly enriched abundances in Healthy compared with CD subjects.

