
FIGURE 3.
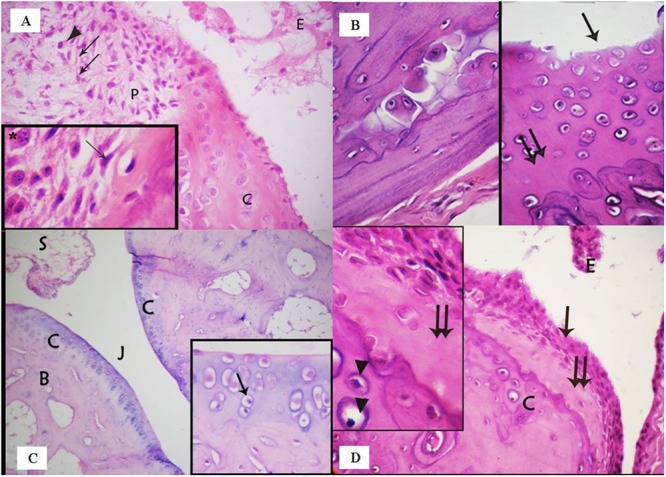
(A) photomicrograph of the rheumatoid arthritis group showing infiltration of the synovial tissue by fibroblast – like spindle shaped cells (↑) and inflammatory cells, e.g., plasma cells (▲). Note that the nearby articular cartilage (C) has lost its basophilia. Notice also inflammatory cells and exudate (E) in the joint cavity. Inset: higher magnification of spindle shaped cells (↑) and plasma cells (∗) in the synovium. (Arthritis group, H & E, ×400; Inset ×1000). (B) Photomicrograph of arthritis group showing: (a) areas of bone destruction within the bone matrix; (b) irregular surface of the articular cartilage with erosion on the surface (↑) and loss of its smooth contour. Note also areas of cell loss (↑↑). (Arthritis, H & E, ×400). (C) Photomicrograph of the ankle joint of the group treated with a methanolic extract of the fungus, showing the articular cartilage (C), the joint cavity (J), and synovial membrane (S). Few degenerated cells are evident (↑). (Methanolic extract group. H & E, ×100; Inset ×400). (D) Photomicrograph of the group treated with an ethanolic extract of the fungus showing the articular cartilage (C) covered by hyperplastic synovium (↑). The underlying cartilage has lost its basophilia and many chondrocytes appear degenerated. Inset: acidophilic matrix, area of cell loss (↑↑), and apoptotic chondrocytes (▲). (Ethyl acetate extract group, H & E, ×400; Inset×1000).