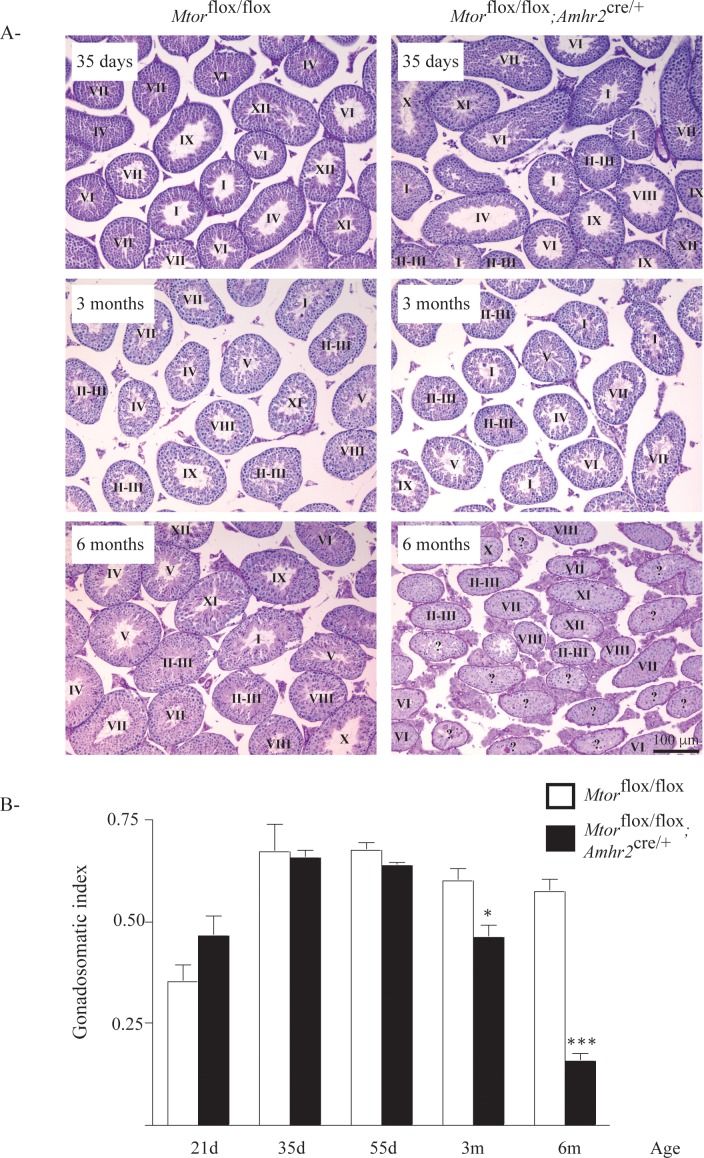
FIG. 2.
Progressive degeneration of the seminiferous tubules in Mtorflox/flox;Amhr2cre/+ mice. A) Photomicrographs compare testicular histology of Mtorflox/flox;Amhr2cre/+ to that of Mtorflox/flox controls at the indicated ages. Scale bar (lower right) is shown for all images; periodic acid–Schiff-hematoxylin stain. Stages of spermatogenic cycles are indicated for each tubule; stages could not be accurately determined for tubules marked with “?” due to loss of germ cells. B) Time course analysis of gonadosomatic index (testicular weight/corporeal weight) comparing Mtorflox/flox;Amhr2cre/+ to Mtorflox/flox controls at the indicated ages. Sample numbers analyzed varied by age and genotype. Values for Mtorflox/flox;Amhr2cre/+ are 21d: n = 6; 35d: n = 4; 55d: n = 4; 3m: n = 8; 6m: n = 10; values for Mtorflox/flox are 21d: n = 6; 35d: n = 3; 55d: n = 5; 3m: n = 5; 6m: n = 5. Data are expressed as means (columns) ± SEM (error bars). *Significant differences from controls (*P < 0.05; ***P < 0.001).

