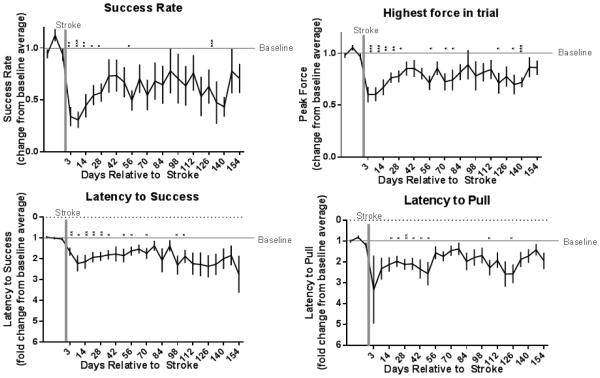
Figure 4 – 2 column.
Recovery data (n=13) collected at days 3, 7, and weekly until day 154 after stroke: error bars represent SEM. Stars above individual time points represent Fishers LSD individual comparisons between that time point and the last baseline time point: p .05 (*), p .05 (**), p .005 (***),and p .0005 (****).

