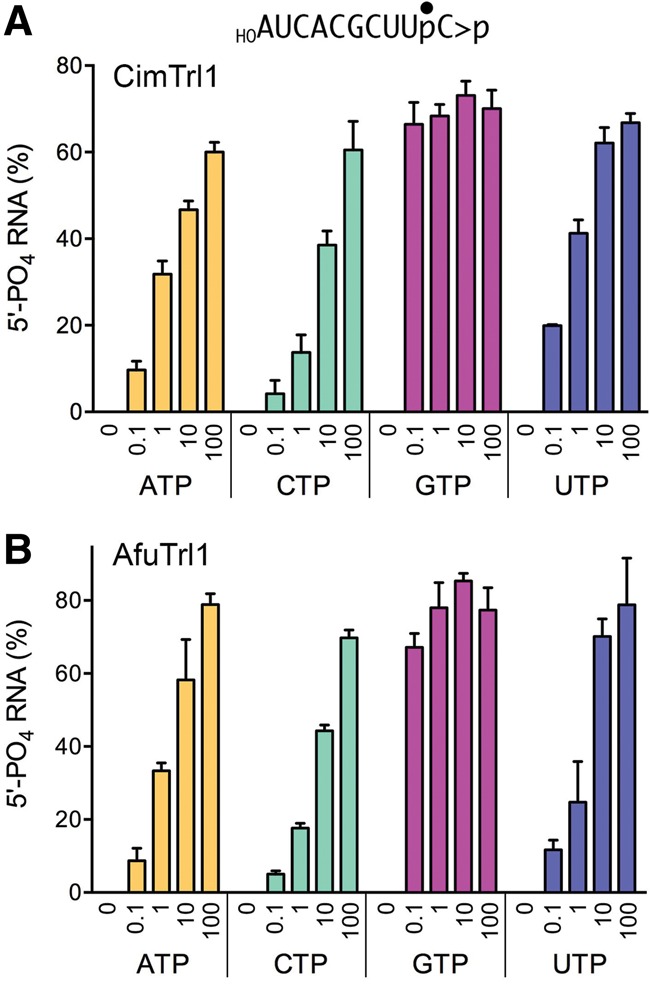
FIGURE 5.

NTP donor specificity of the AfuTrl1 and CimTrl1 5′ kinase reaction. Reaction mixtures (20 µL) containing 50 mM Tris–HCl (pH 7.5), 2 mM DTT, 10 mM MgCl2, 20 nM 10-mer HORNA>p, 200 nM CimTrl1 (panel A) or AfuTrl1 (panel B) KIN-CPD enzyme, and 0, 0.1, 1, 10, or 100 µM of the indicated NTP (ATP, CTP, GTP, or UTP) were incubated at 22°C for 2 min. The products were analyzed by urea–PAGE. The extents of 5′ phosphorylation were quantified by scanning the gel and are plotted in bar graph format as a function of NTP concentration. Each datum is the average of three separate experiments ±S.E.M.
