FIGURE 4.
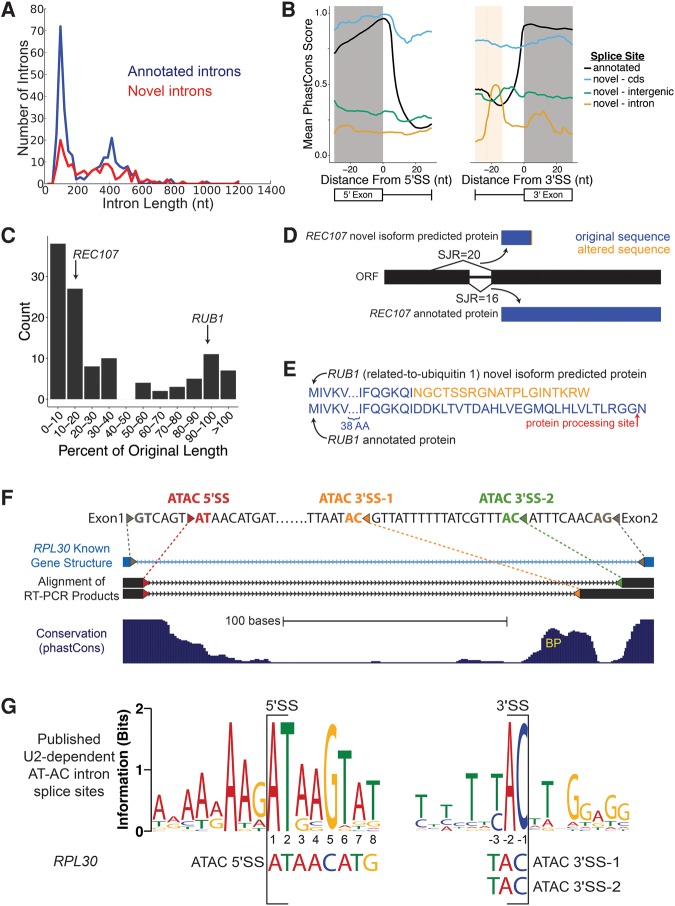
RNA-seq discovers additional novel introns. (A) Length distribution of annotated (blue) and novel (red) splice junctions. Novel splice junctions include any junction with entropy ≥2 bits. (B) Conservation of splice sites for annotated splice sites (black) and novel splice sites located in annotated CDS (blue), introns (yellow), and outside of ORFs (green). Average predicted BP location for intronic 3′SS is denoted with dotted line, shading is ±1 SD (only plotting −30 to +30 nt around the splice site). For 5′SS, annotated n = 282, CDS n = 14, intron n = 19, intergenic n = 18. For 3′SS, annotated n = 282, CDS n = 34, intron n = 7, intergenic n = 18. (C) Effect on coding length of ORFs from splicing out of novel introns. Predicted change to the coding sequence of REC107 (D) and RUB1 (E) after splicing out novel introns. Red arrow indicates location of RUB1 protein cleavage prior to its addition to substrates. (F) RT-PCR sequence (black) aligns to annotated intron of RPL30 (light blue), SacCer3 genome assembly (Kent 2002). Colored triangles represent splice sites. Gray, annotated splice sites; red, AT-AC 5′SS; orange, AT-AC 3′SS 1; green, AT-AC 3′SS 2. Depending on which AC/ 3′SS is used, the second AUG is either 104 nt or 170 nt downstream from the truncated main ORF. (G) WebLogo of published U2-dependent AT-AC intron 5′SS and 3′SS. RPL30 AT-AC splice sites shown below (Sheth et al. 2006).

